Pricing Strategies - A Primer on Value for Money
Value for money in healthcare is a foreign concept for stakeholders in the U.S. health economy, in part because it originates with England’s National Health Service (NHS). As one might expect of the English, the NHS has a constitution, with “seven key principles [that] guide the NHS in all it does.”1 The third, sixth and seventh principles of the NHS Constitution are as follows:
3. The NHS aspires to the highest standards of excellence and professionalism
It provides high quality care that is safe, effective and focused on patient experience; in the people it employs, and in the support, education, training and development they receive; in the leadership and management of its organisations; and through its commitment to innovation and to the promotion, conduct and use of research to improve the current and future health and care of the population. Respect, dignity, compassion and care should be at the core of how patients and staff are treated not only because that is the right thing to do but because patient safety, experience and outcomes are all improved when staff are valued, empowered and supported.
6. The NHS is committed to providing best value for taxpayers’ money
It is committed to providing the most effective, fair and sustainable use of finite resources. Public funds for healthcare will be devoted solely to the benefit of the people that the NHS serves.
7. The NHS is accountable to the public, communities and patients that it serves
The NHS is a national service funded through national taxation, and it is the government which sets the framework for the NHS and which is accountable to Parliament for its operation. However, most decisions in the NHS, especially those about the treatment of individuals and the detailed organisation of services, are rightly taken by the local NHS and by patients with their clinicians. The system of responsibility and accountability for taking decisions in the NHS should be transparent and clear to the public, patients and staff. The government will ensure that there is always a clear and up-to-date statement of NHS accountability for this purpose.
While the NHS’s performance against its principles and values is the subject of debate, focusing on value for money is a cornerstone for all NHS stakeholders.2,3,4 The NHS highlights the inherent tension between the quality and cost of healthcare with its commitment “to providing the most effective, fair and sustainable use of finite resources.” To accomplish this, the National Institute for Health and Care Excellence (NICE) was established in 1999 to “evaluate new health technologies for NHS use, considering clinical effectiveness and value for money.”5
Unlike the British, Americans pretend that healthcare resources are infinite. In reality, the U.S. health economy desperately needs each of its stakeholders to adopt this mission:
While that is unlikely to happen, health economy stakeholders who deliver value for money more consistently than their competitors – whether providers or health insurers or life sciences firms – will win healthcare’s negative sum game.
Basic economic principles, as well as logic, suggest that every stakeholder must be able to deliver products or services profitably at, or even slightly below, the market range of payment for that product or service or else exit that market. Professor Herzlinger wrote about this in 1997:
“The American health care industry is filled with opportunities to establish focused factories, ranging from those that perform only one procedure, like cataract surgery, to those that provide the full panoply of care for a disease like cancer. To fulfill the promise of focused factories, however, the industry will have to resize – that is, replace its unfocused multipurpose providers and redundant, underutilized technology with muscular focused factories, loaded with cost-saving, quality-enhancing medical technology.”6
Dr. Drucker cited the example of DuPont:
“By contrast, DuPont has remained the world’s largest producer of synthetic fibers because, in the mid-1940s, it offered its new and patented nylon on the world market for the price at which it would have to be sold five years hence to maintain itself against competition. This was some two-fifths lower than the price DuPont could then have gotten from the manufacturers of women’s hosiery and underwear.
DuPont’s move delayed competition by five or six years. But it also immediately created a market for nylon that nobody at the company had even thought about (for example, in automobile tires), and this market soon became both bigger and more profitable than the women’s wear market could ever have been. This strategy thus produced a much larger total profit for DuPont than charging what the traffic would bear could have done. And DuPont kept the markets when the competitors did appear, after five or six years.”7
As noted in Chapter 3, the most important elements of value in healthcare services are cost, quality, safety and convenience, but the importance of quality as an element of value is highly variable depending on the type of care. As a result, value for money in healthcare is a dynamic concept that depends on the type of product or service being delivered, the complexity of the product or service and the relative and comparative price of that product or service, as well as the relative and comparative price of substitute goods.
Health economy stakeholders can deliver value for money to the customer – the employer – in one of three ways:
- Better than average quality at a price at or near the median market rate
- Average quality at a price that is below the median market rate
- Better than average quality at a price that is below the median market rate
There is no value for money proposition in offering worse than average quality at any rate, especially one that is higher than the median market rate.
Use Case: Identifying Providers Delivering Value for Money
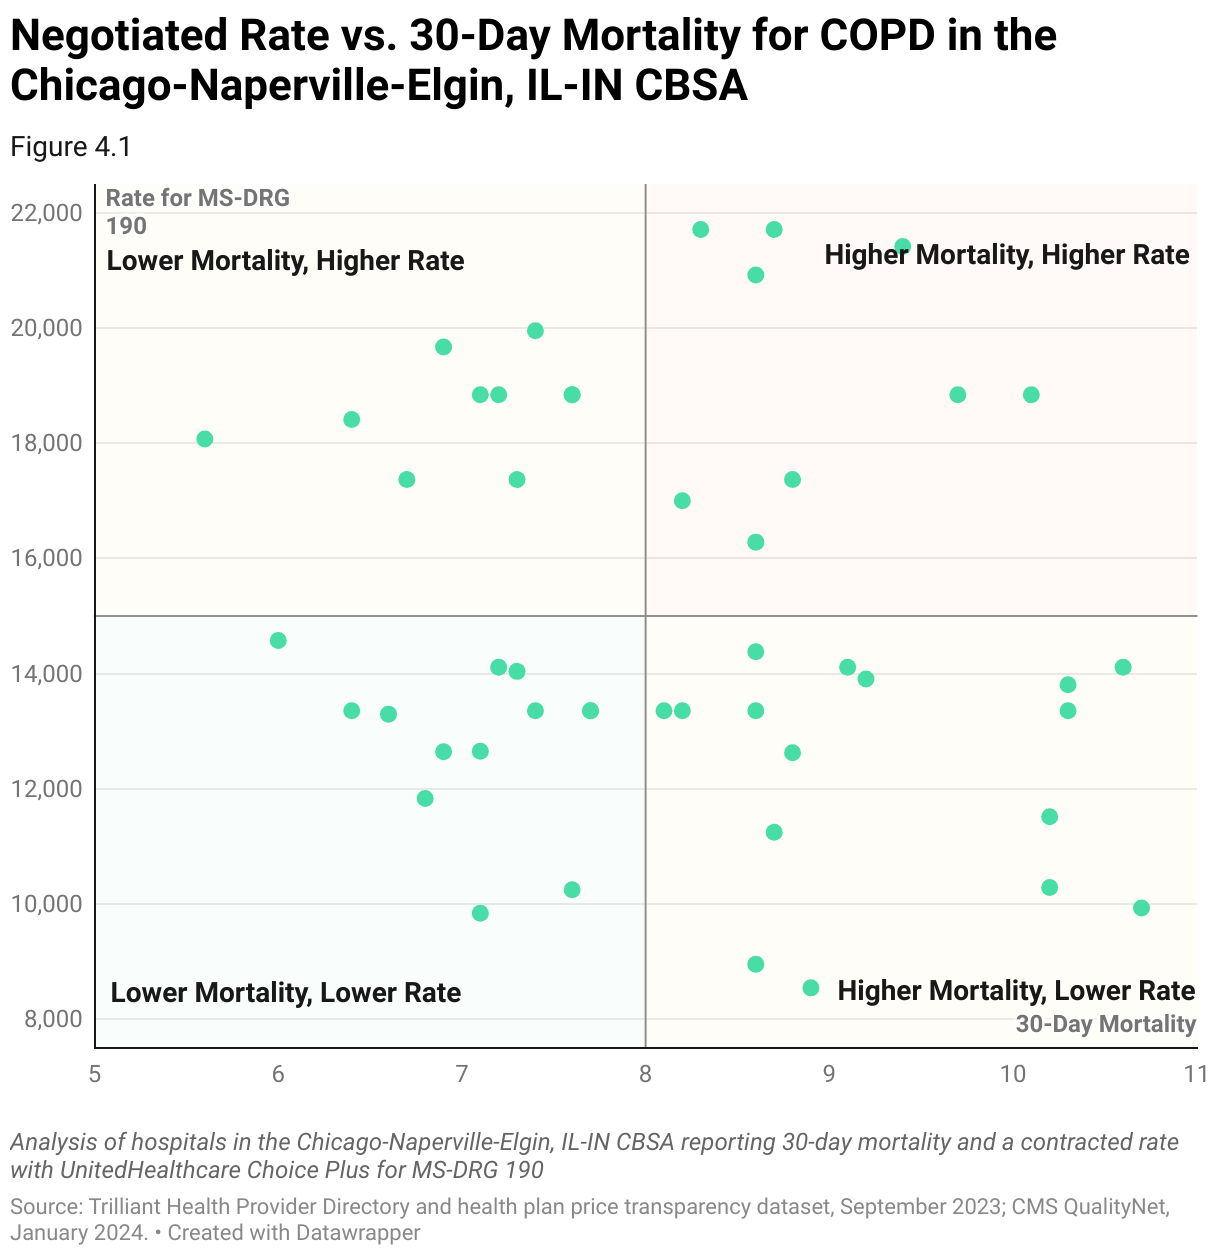
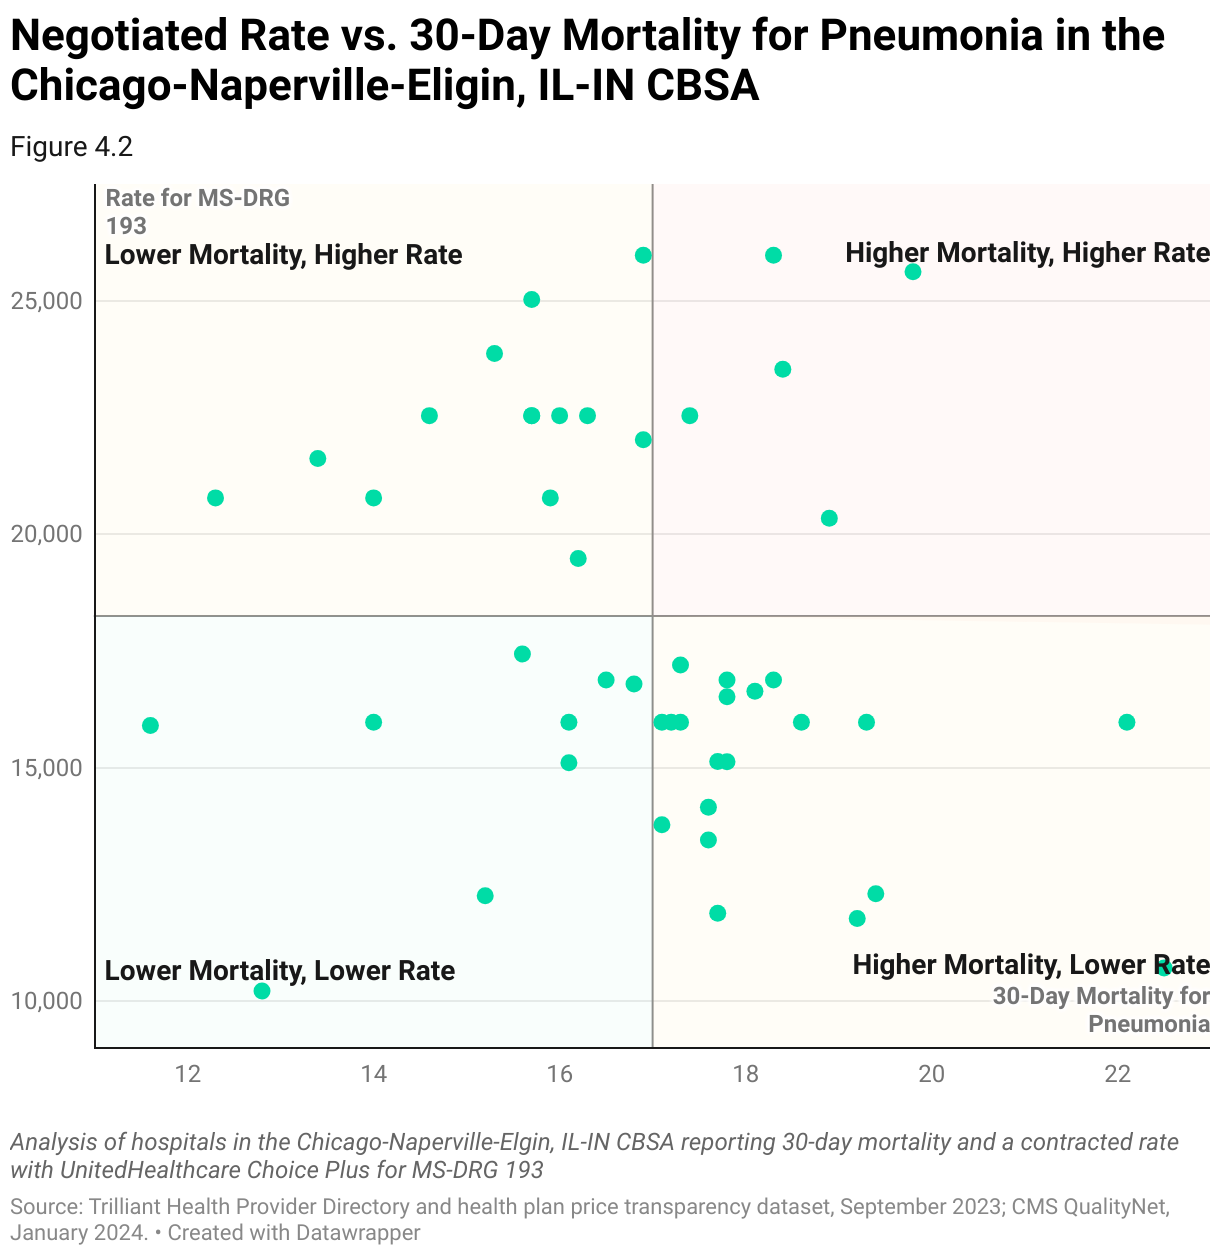
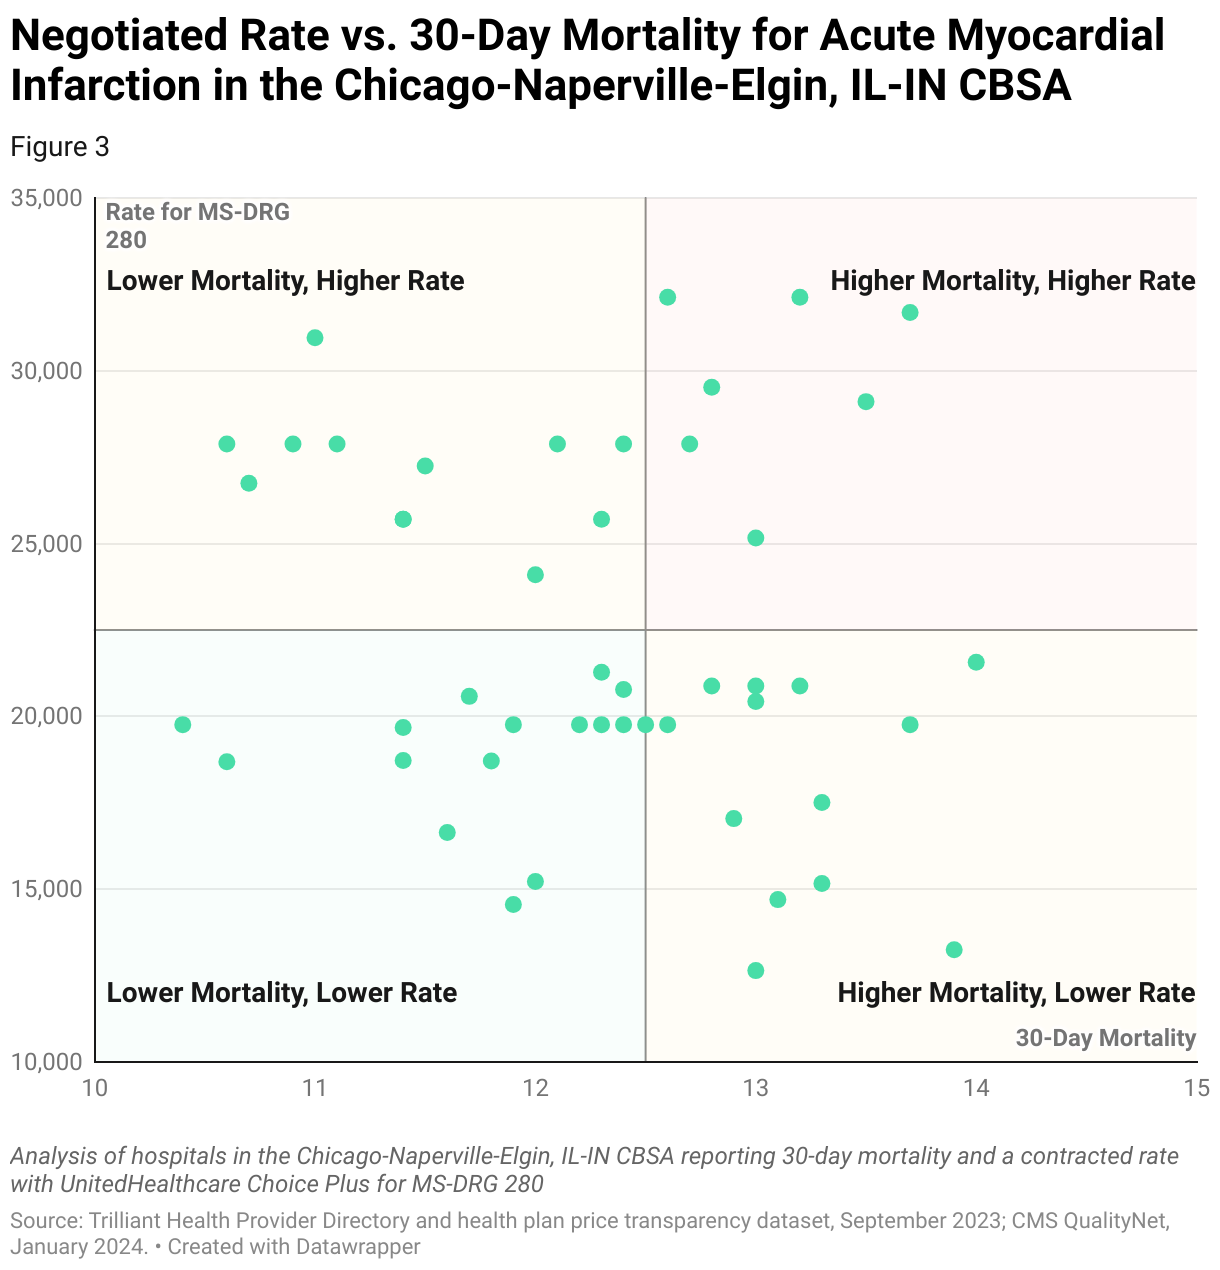
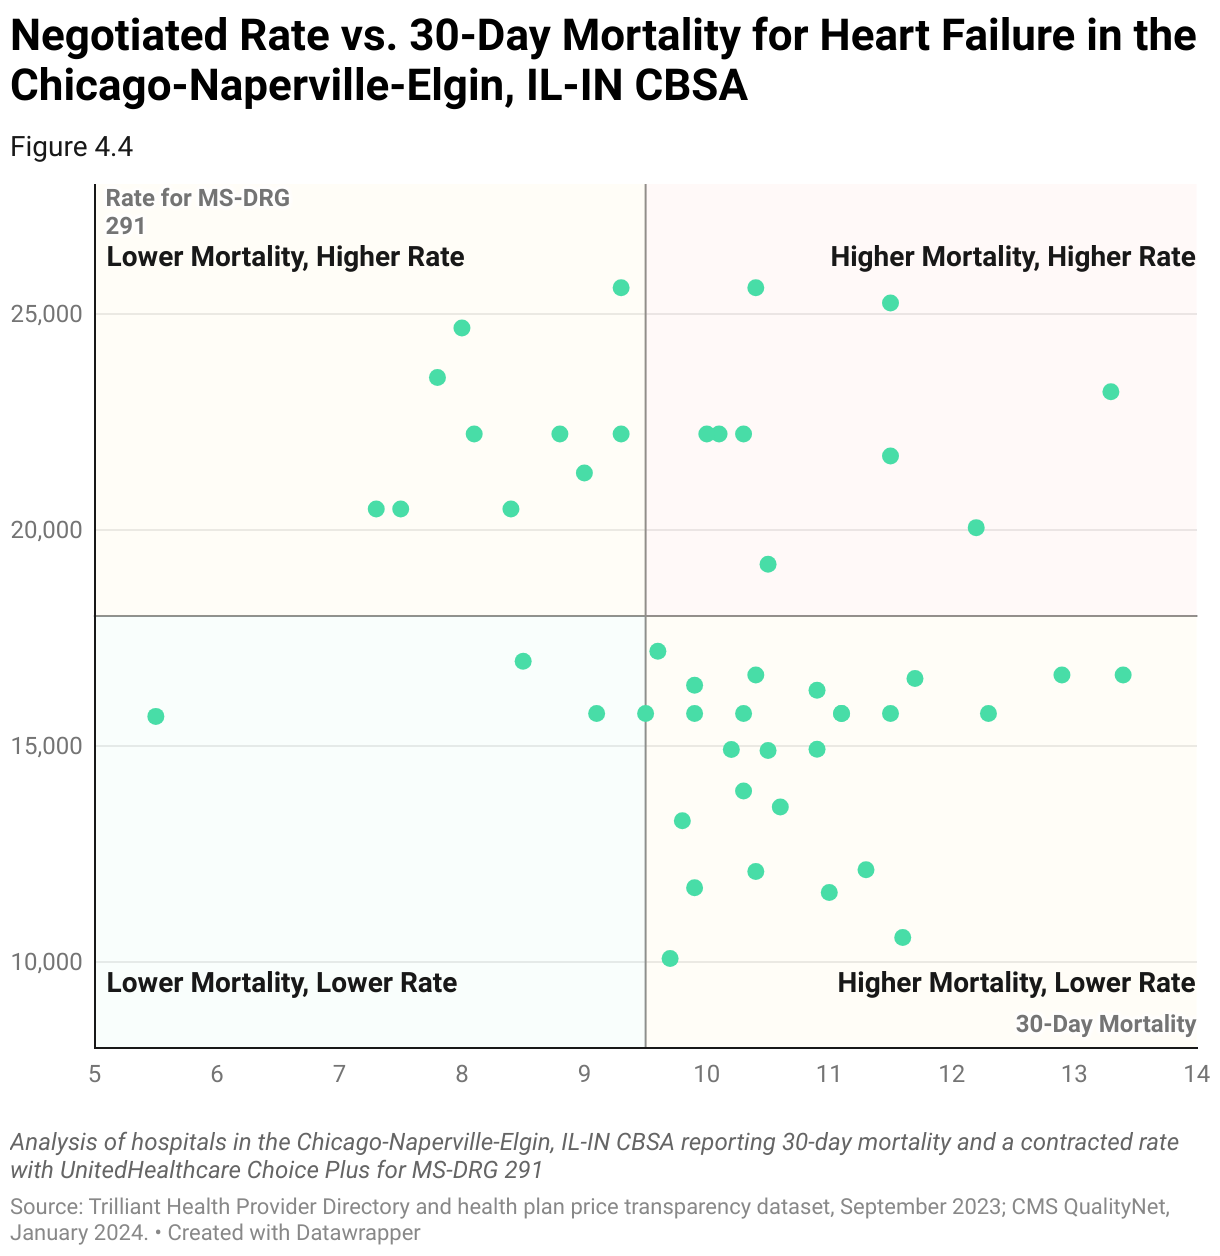
Value in the health economy exists at the intersection of quality outcomes and negotiated rate. William Farr famously stated that “death is a fact; all else is inference.” As such, mortality is the ultimate measure of quality, making it the most important quality metric in determining value.
As detailed in the Introduction, there is no observed correlation between price and quality in healthcare services at the national level. In the following examples, using a combination of provider directory, CMS QualityNet and health plan price transparency data, hospitals in the Chicago-Naperville-Elgin, IL-IN CBSA are benchmarked comparing in-network negotiated rates with 30-day post-discharge mortality for MS-DRG 190 – COPD, MS-DRG 193 – Pneumonia, MS-DRG 280 – Acute Myocardial Infarction and MS-DRG 291 – Heart Failure, respectively.
Steps to Identify Providers Delivering Value for Money
- Curate Internal Data
Curate internal financial performance data, including revenue, profitability and cost structures. Pull utilization data to demonstrate the volume and types of services consumed by the target patient population. Highlight any areas of high demand or specialized services.
- Curate External Market Data
Collect comprehensive data on reimbursement rates, including negotiated rates by various health insurers to different healthcare providers. Normalize the rate data to align with internal service line definitions and classifications, including mapping external billing codes to internal service line categories. Leverage external data to identify specific metrics that are relevant indicators of healthcare quality. These should include patient outcomes (e.g., mortality rates, complication rates), patient satisfaction scores and process measures (e.g., adherence to clinical guidelines).
- Data Cleaning and Preparation
Clean and prepare the market data by checking for missing values, outliers and inconsistencies. Leverage market utilization to identify and remove negotiated rates that are clinically implausible. Assign the provider organization name using the billing NPI and/or EIN. Group individual organizations based on system ownership and isolate target care settings for detailed reporting around inpatient and outpatient services. Transform the raw data into a format suitable for statistical analysis.
- Benchmarking
Leverage external market data to better understand competitive contract structure and negotiated rates at the billing code level. Compare negotiated rates and quality metrics to industry benchmarks and to other providers and health insurers in the target market. Establish a baseline for market performance and highlight cost variations among different providers and health insurers.
- Correlation Analysis
Analyze the correlation between negotiated rates and quality metrics. Use statistical methods to identify any significant correlations between higher reimbursement and better quality of care. Consider any potential confounding variables that may influence the relationship between negotiated rates and quality metrics. These could include patient demographics, case mix, severity of illness or other factors that may affect both reimbursement and quality of care. Control for these variables by including them as covariates in the analysis or conducting subgroup analyses.
- Communicate Findings
Present findings in a clear and concise manner, using tables, charts, and graphs to illustrate the relationship between negotiated rates and quality metrics. Clearly communicate the implications of the analysis for the negotiation process, emphasizing any statistically significant correlations and their potential impact on healthcare delivery.
- Monitor and Adjust
Continuously monitor market trends, quality metrics and policies to stay informed and adjust strategy as needed. Regularly review and update the analysis to maintain a strong position over time.
Footnotes
-
https://www.gov.uk/government/publications/the-nhs-constitution-for-england/the-nhs-constitution-for-england ↩
-
https://www.nuffieldtrust.org.uk/sites/default/files/2018-06/the-nhs-at-70-how-good-is-the-nhs.pdf ↩
-
Herzlinger, Regina. Resizing – The “Trade Fat For Muscle Diet.” Market-Driven Health Care, Addison-Wesley Publishing Company, Inc., 1997, page 158. ↩