Introduction: Know Your Customer
Identifying a target customer is the first step in winning their business, but most health economy stakeholders don’t know who their customer is.
Physicians: The Health Economy’s Presumed Customer
Since Benjamin Franklin co-founded Pennsylvania Hospital in 1751, most health economy stakeholders have implicitly or explicitly assumed that – and behaved as if – their customer was the physician. Although stakeholders have in recent years endorsed and promoted “consumer-directed care” and “patient engagement,” the inner workings of the health economy suggest that “consumerism” is simply a word that abounds in PowerPoint presentations.
For decades, hospital administrators have been taught that a happy medical staff is paramount, and physicians have skillfully leveraged this conceit in their demands for equipment purchases and operating room block scheduling and even the menu in the physician dining room. Life sciences firms are certain that their customer is the physician, or at least the logoed pen in the physician’s hand, without which no implant or device or therapeutic would ever be ordered or prescribed.
This arrangement has largely persisted because the end users of services, the frequently cited “consumers,” have not objected to being treated as “patients” by hospitals and physicians. Until recently, patients have faithfully followed doctors’ orders, particularly with respect to referrals for services. As a result, healthcare providers have not been required to market or sell their services to patients, the actual “consumers” of those services, to increase market share. The continued expansion by Amazon and Walmart into consumer healthcare delivery challenges that longstanding notion.
Unsurprisingly, life sciences firms have focused on developing (lucrative) relationships with physicians, knowing that the new implant or device or therapeutic requires a physician order and that patients most likely will consent to follow the physician’s recommendation. To hedge their bets, pharmaceutical firms spend billions of dollars on advertisements showing idyllic, if bizarre, examples of happy patients living their best life after beginning a therapeutic regimen.
Physicians and Patients: The Antagonists of Health Insurers
In contrast, physicians – and patients – are the antagonists of health insurers. Physicians are the root cause of MLR, i.e., medical loss ratio, the rather curious term that health insurers use to describe the claims paid to reimburse providers for rendering care to patients out of the pool of premiums the insurer received as revenue.
Who is the customer of the health insurer? Historically, anyone who will pay to access a provider network or for claims adjudication. Increasingly, pharmaceutical firms are a valuable customer for health insurers because of rebates that generate significant revenue, especially under Medicare Part D.1
Why isn’t the employer the customer of the health insurer? In part, because health insurers long ago ceded control of the distribution channel to health insurance brokers and seem curiously loath to retake it. Ironically, employers believe that they are the customer of the health insurance broker, failing to realize that the health insurance broker is a mercenary, not a fiduciary.
Why are health insurers the customer of the brokers? Because health plans pay billions of dollars in annual commissions to brokers for the only steerage consistently occurring in healthcare.
Over time, health insurance brokers are the most endangered health economy stakeholder. If 23.1M Americans can enroll in healthcare benefits via the ACA Marketplace and 35M more can enroll in Medicare Advantage plans, the raison d’être for health insurance brokers is unclear.2 3 The advent of health plan price transparency will increasingly implicate the fiduciary duties of employer CFOs to justify the need for lavishly remunerated middleman to provide a service that over 58M Americans access over the Internet.
Why isn’t the consumer, i.e., the patient, the end user of healthcare services, the customer of the health insurer? Health insurers either underwrite the cost of healthcare coverage for employers, aka their “fully insured business,” or they provide administrative services like network access, claims payment, etc., to self-insured employers, aka their “ASO business.”
In the fully insured business, consumers, aka “members,” are a cost center, in contrast to the rest of the economy where the consumer is a source of revenue. As a result, health insurers don’t want “customers for life,” unlike the rest of the economy. Whether that mindset explains the typical 100% churn of fully insured groups over a four-year period or whether the inevitable churn informs the mindset, health insurers have little incentive to focus on a “member” as a consumer or to invest in that member’s “health and wellness” to create savings that a subsequent payer would realize.
In the ASO business, consumers are completely irrelevant to the health insurer, with their name, date of birth, gender and home address merely data fields in an electronic transaction that the health insurer is paid to administer. The indifference that legacy ASO providers have for consumers has provided an opportunity for “healthcare advocacy” firms like Accolade and Quantum Health.
Medicare Advantage is seemingly different because of the incessant direct to consumer advertising during annual enrollment. Fundamentally, however, Medicare Advantage is a fully insured business model, with the capitated amount per enrollee underwritten by the Federal government, in turn making hospitals, physicians and members the antagonists of every MA plan.
How Employer-Sponsored Health Insurance Shapes the Health Economy
Nevertheless, the employer is and has been, if unknowingly, the primary customer of every health economy stakeholder for decades. It is axiomatic that “he who has the gold makes the rules,” and employer-sponsored health insurance is the fuel of the U.S. health economy. As health plan price transparency reveals the fact that price is not correlated with quality, every other health economy stakeholder should assume that employers will begin to reconsider how they are spending their gold.
A curious observer might ask why employers are even involved in the U.S. healthcare system, much less the participant with the most latent power. The answer? The War Board’s 1943 decision to exempt employer-sponsored health insurance from the wage freeze introduced by the Stabilization Act of 1942.4
Joseph Schumpeter stated that “history is a record of the ‘effects’ the vast majority of which nobody intended to produce,” and there is no better example than employer-sponsored health insurance, the “elephant in the room” of the U.S. healthcare system. No part of the U.S. health economy better exemplifies the status quo than the way that human resource departments administer employer-sponsored health insurance. Peak status quo manifests annually during “open enrollment,” in which employers, relying on sensitivity analyses prepared by benefits consultants, shift as much of the ever-increasing cost of health insurance to employees without creating an insurrection.
There is nothing that would unleash innovation in and transformation of the U.S. health economy more than the elimination of the tax deduction for employer-sponsored health insurance, which is why the status quo has never allowed that to happen. And, so, as illogical and distasteful as it may be, the employer is and will be the epicenter of the U.S. health economy, until it collapses under its own weight.
The Difference Between Value-Based Care and Value for Money
In the last decade, numerous market forces have influenced how consumers access healthcare services. Physicians increasingly refer patients to a variety of ambulatory care settings, both for convenience and economic gain. Employers are more willing to consider limiting choice for employees to “narrow networks” in response to persistent increases in health insurance premiums. Consumers increasingly shop for care with rising expectations of an exceptional customer experience in response to unlimited information on the Internet, widely available decision support tools and increasing personal financial responsibility for utilizing healthcare. And, as noted above, large retailers like Amazon and Walmart have begun to offer a variety of healthcare services — from low-acuity care to chronic-condition management — to complement their massive pharmaceutical distribution capabilities.
Employers are also slowly realizing the difference between value-based care, which allows employers to cap financial risk, and value for money, which allows employers to reduce costs.
Value in healthcare is like any other commodity, product or service, the combination of what you receive in exchange for what you paid and the likelihood that you will want it again. The elements of healthcare value include price, quality, efficiency, effectiveness, outcomes, process, experience and brand perception.
The Uncomfortable Truth About Healthcare Quality
Quality in healthcare is an amorphous concept, a patchwork of process measures, patient perception and adverse events. Twenty-five years after the Institute of Medicine’s To Err is Human, post-hospital discharge mortality is stubbornly high, and health system performance on quality measures is relatively average. More importantly, there is no observed correlation between price and quality in healthcare services at the national level.
To demonstrate this, we examined the correlation between common quality measures reported to CMS and/or the CDC and the corresponding in-network rate paid by UnitedHealthcare for select high-volume DRGs.
Correlation is a measure of the relationship, or lack thereof, between two things. For example, height and weight have a strong correlation; height and eye color do not. Our correlation analysis included the following common measures:
- Pearson’s Product Moment Correlation Coefficient, which measures the strength of the linear correlation between two variables;
- Spearman’s Rank Correlation Coefficient measures the strength of the monotonic correlation between two variables; and
- Mutual Information (MI), which measures non-linear relationships between two variables.5,6
Data scientists commonly use home sales data to illustrate the effectiveness of correlation measures. Analyzing a data source that contains housing sales in Ames, Iowa, from 2006-2010, it is clear from the Pearson (p), Spearman (s) and Mutual Information (mi) analysis that the strongest positive correlation (p=0.707) is between housing prices and the square footage of the house, which is unsurprising. Logically, as the size of a house increases, the more it will cost.
Home Price vs Square Footage of House in Ames, IA, 2006–2010
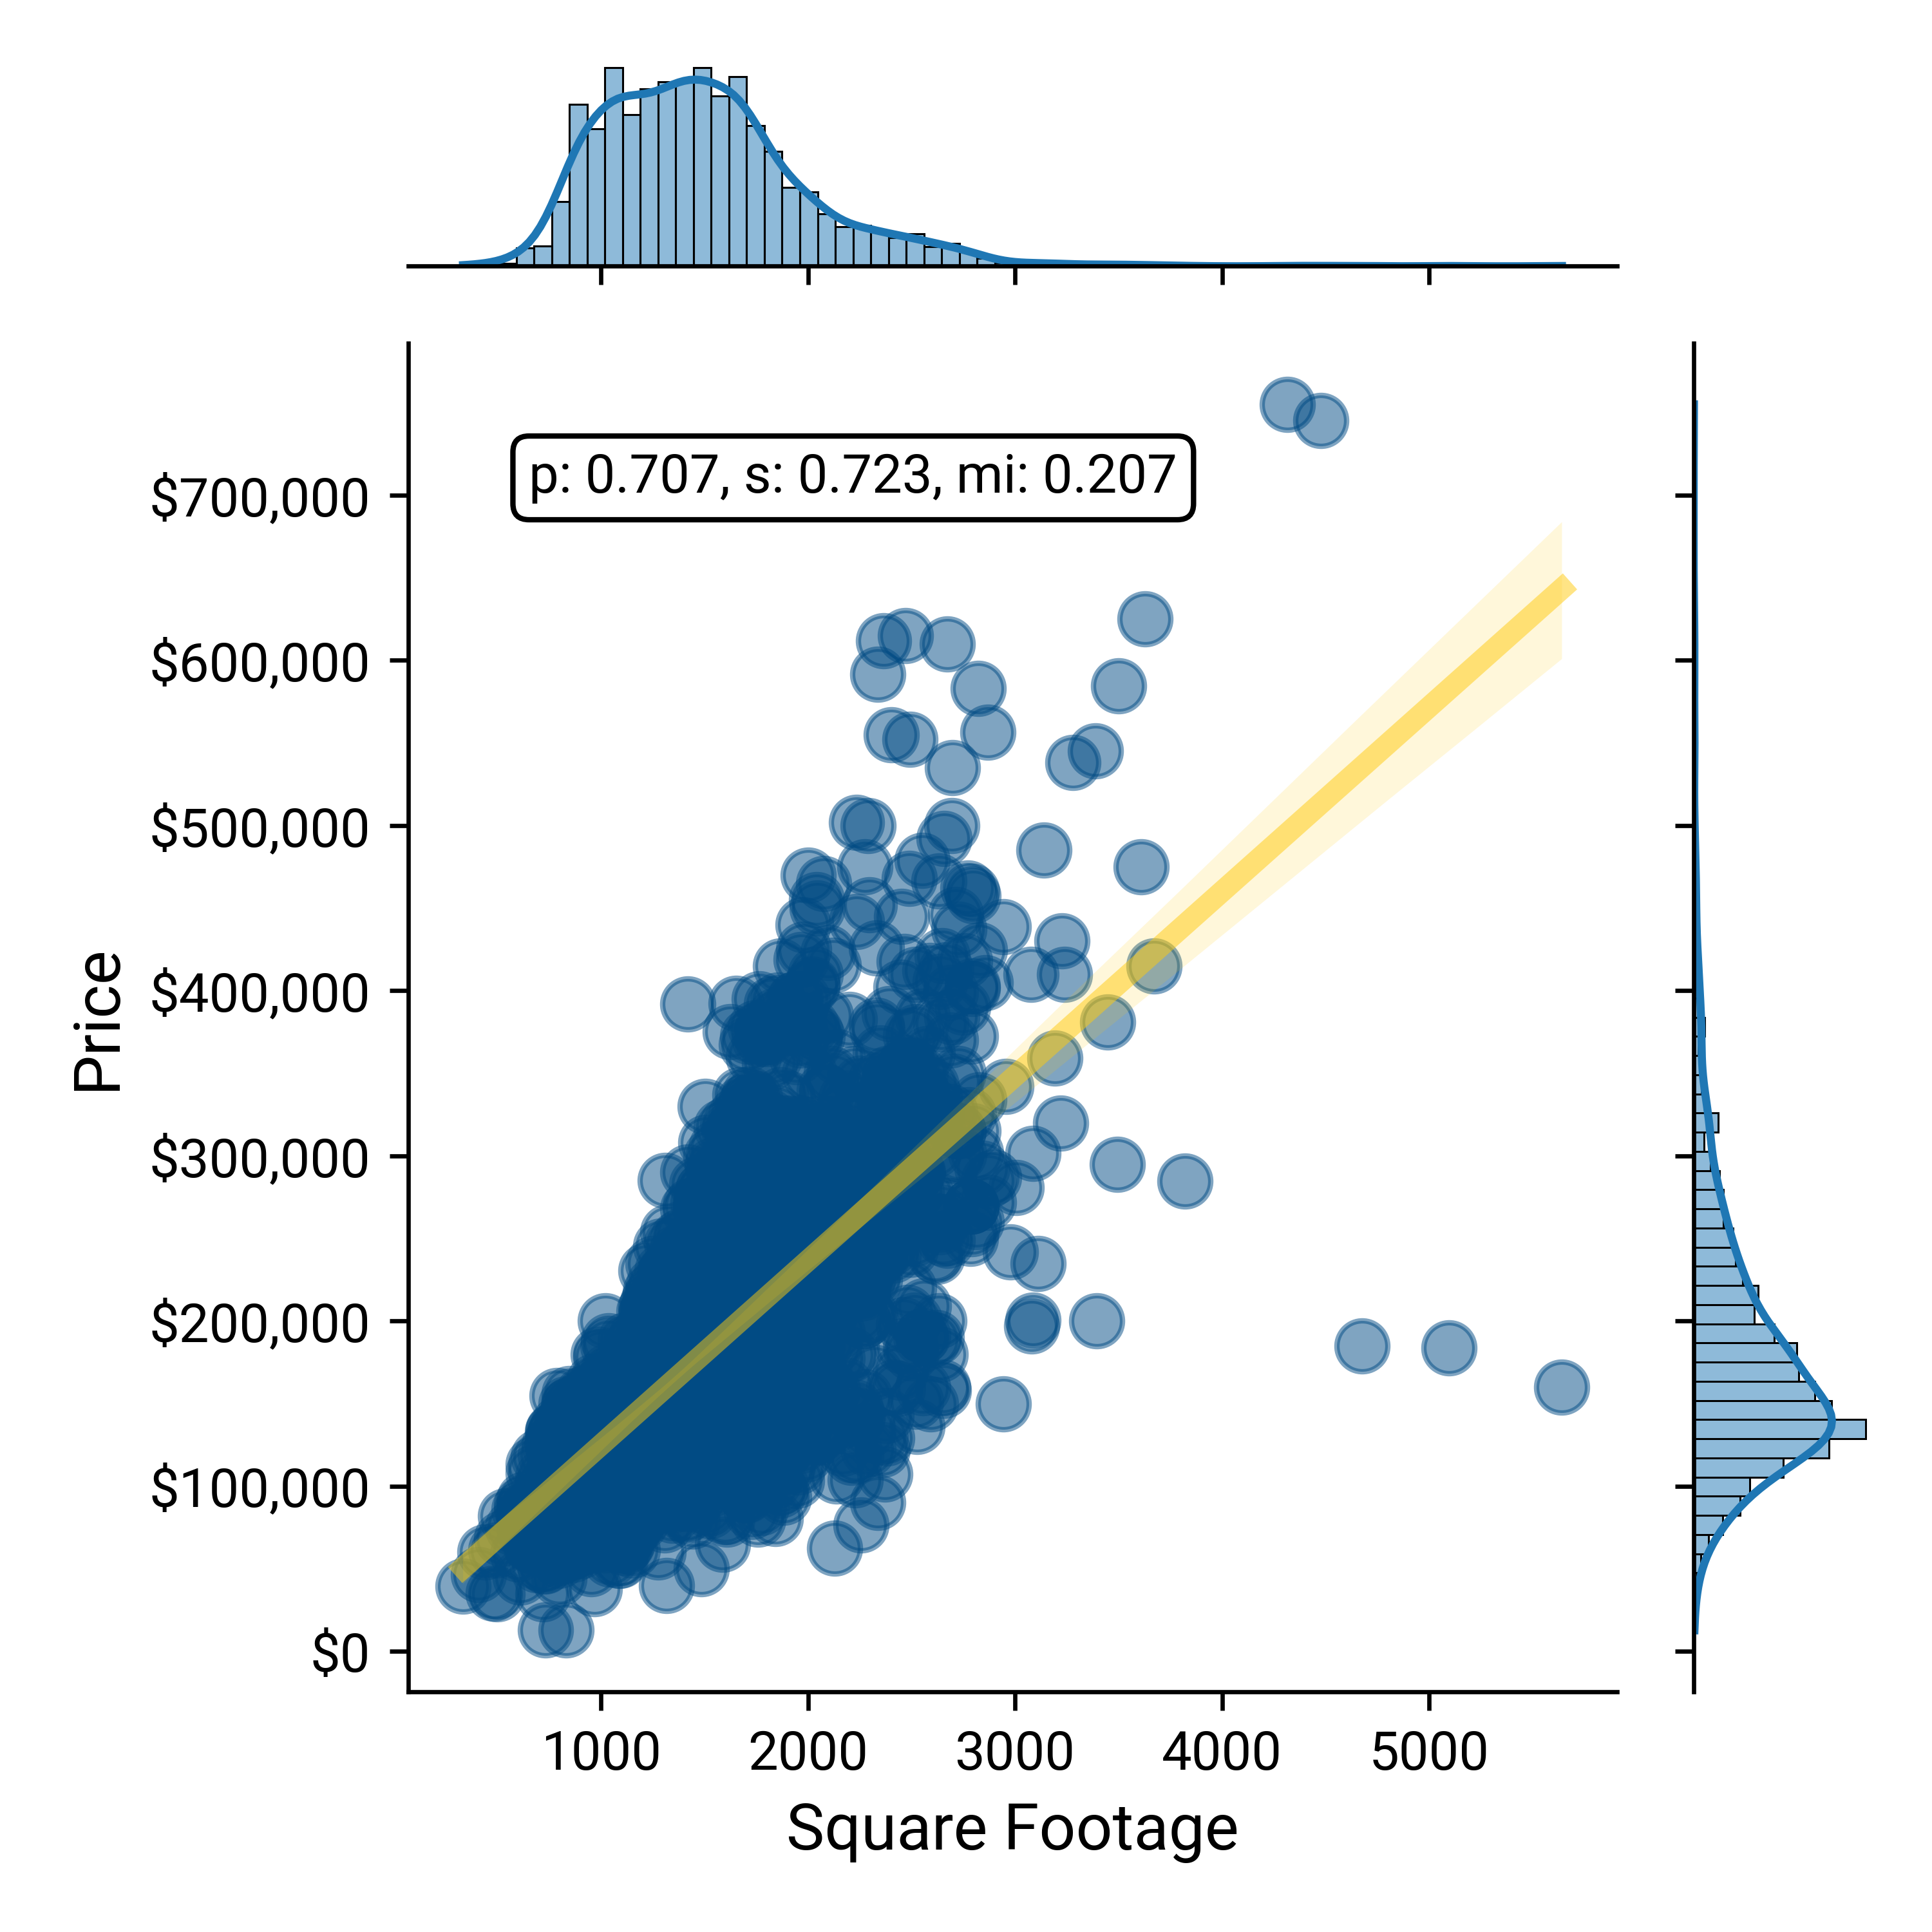
Source: De Cock, Dean. “Ames, Iowa: Alternative to the Boston housing data as an end of semester regression project.” Journal of Statistics Education 19.3 (2011)
There is a slightly weaker but moderate positive correlation (p=0.558) between the age of the house and its price, which is also logical since new homes generally cost more than old homes. At the same time, there are plenty of renovated homes, or older homes in desirable neighborhoods, that are expensive. So, while the age of a home is a good indicator of its price, it is not quite as good of an indicator as the square footage.
Home Price vs Year Built for Homes Sold in Ames, IA, 2006-2010
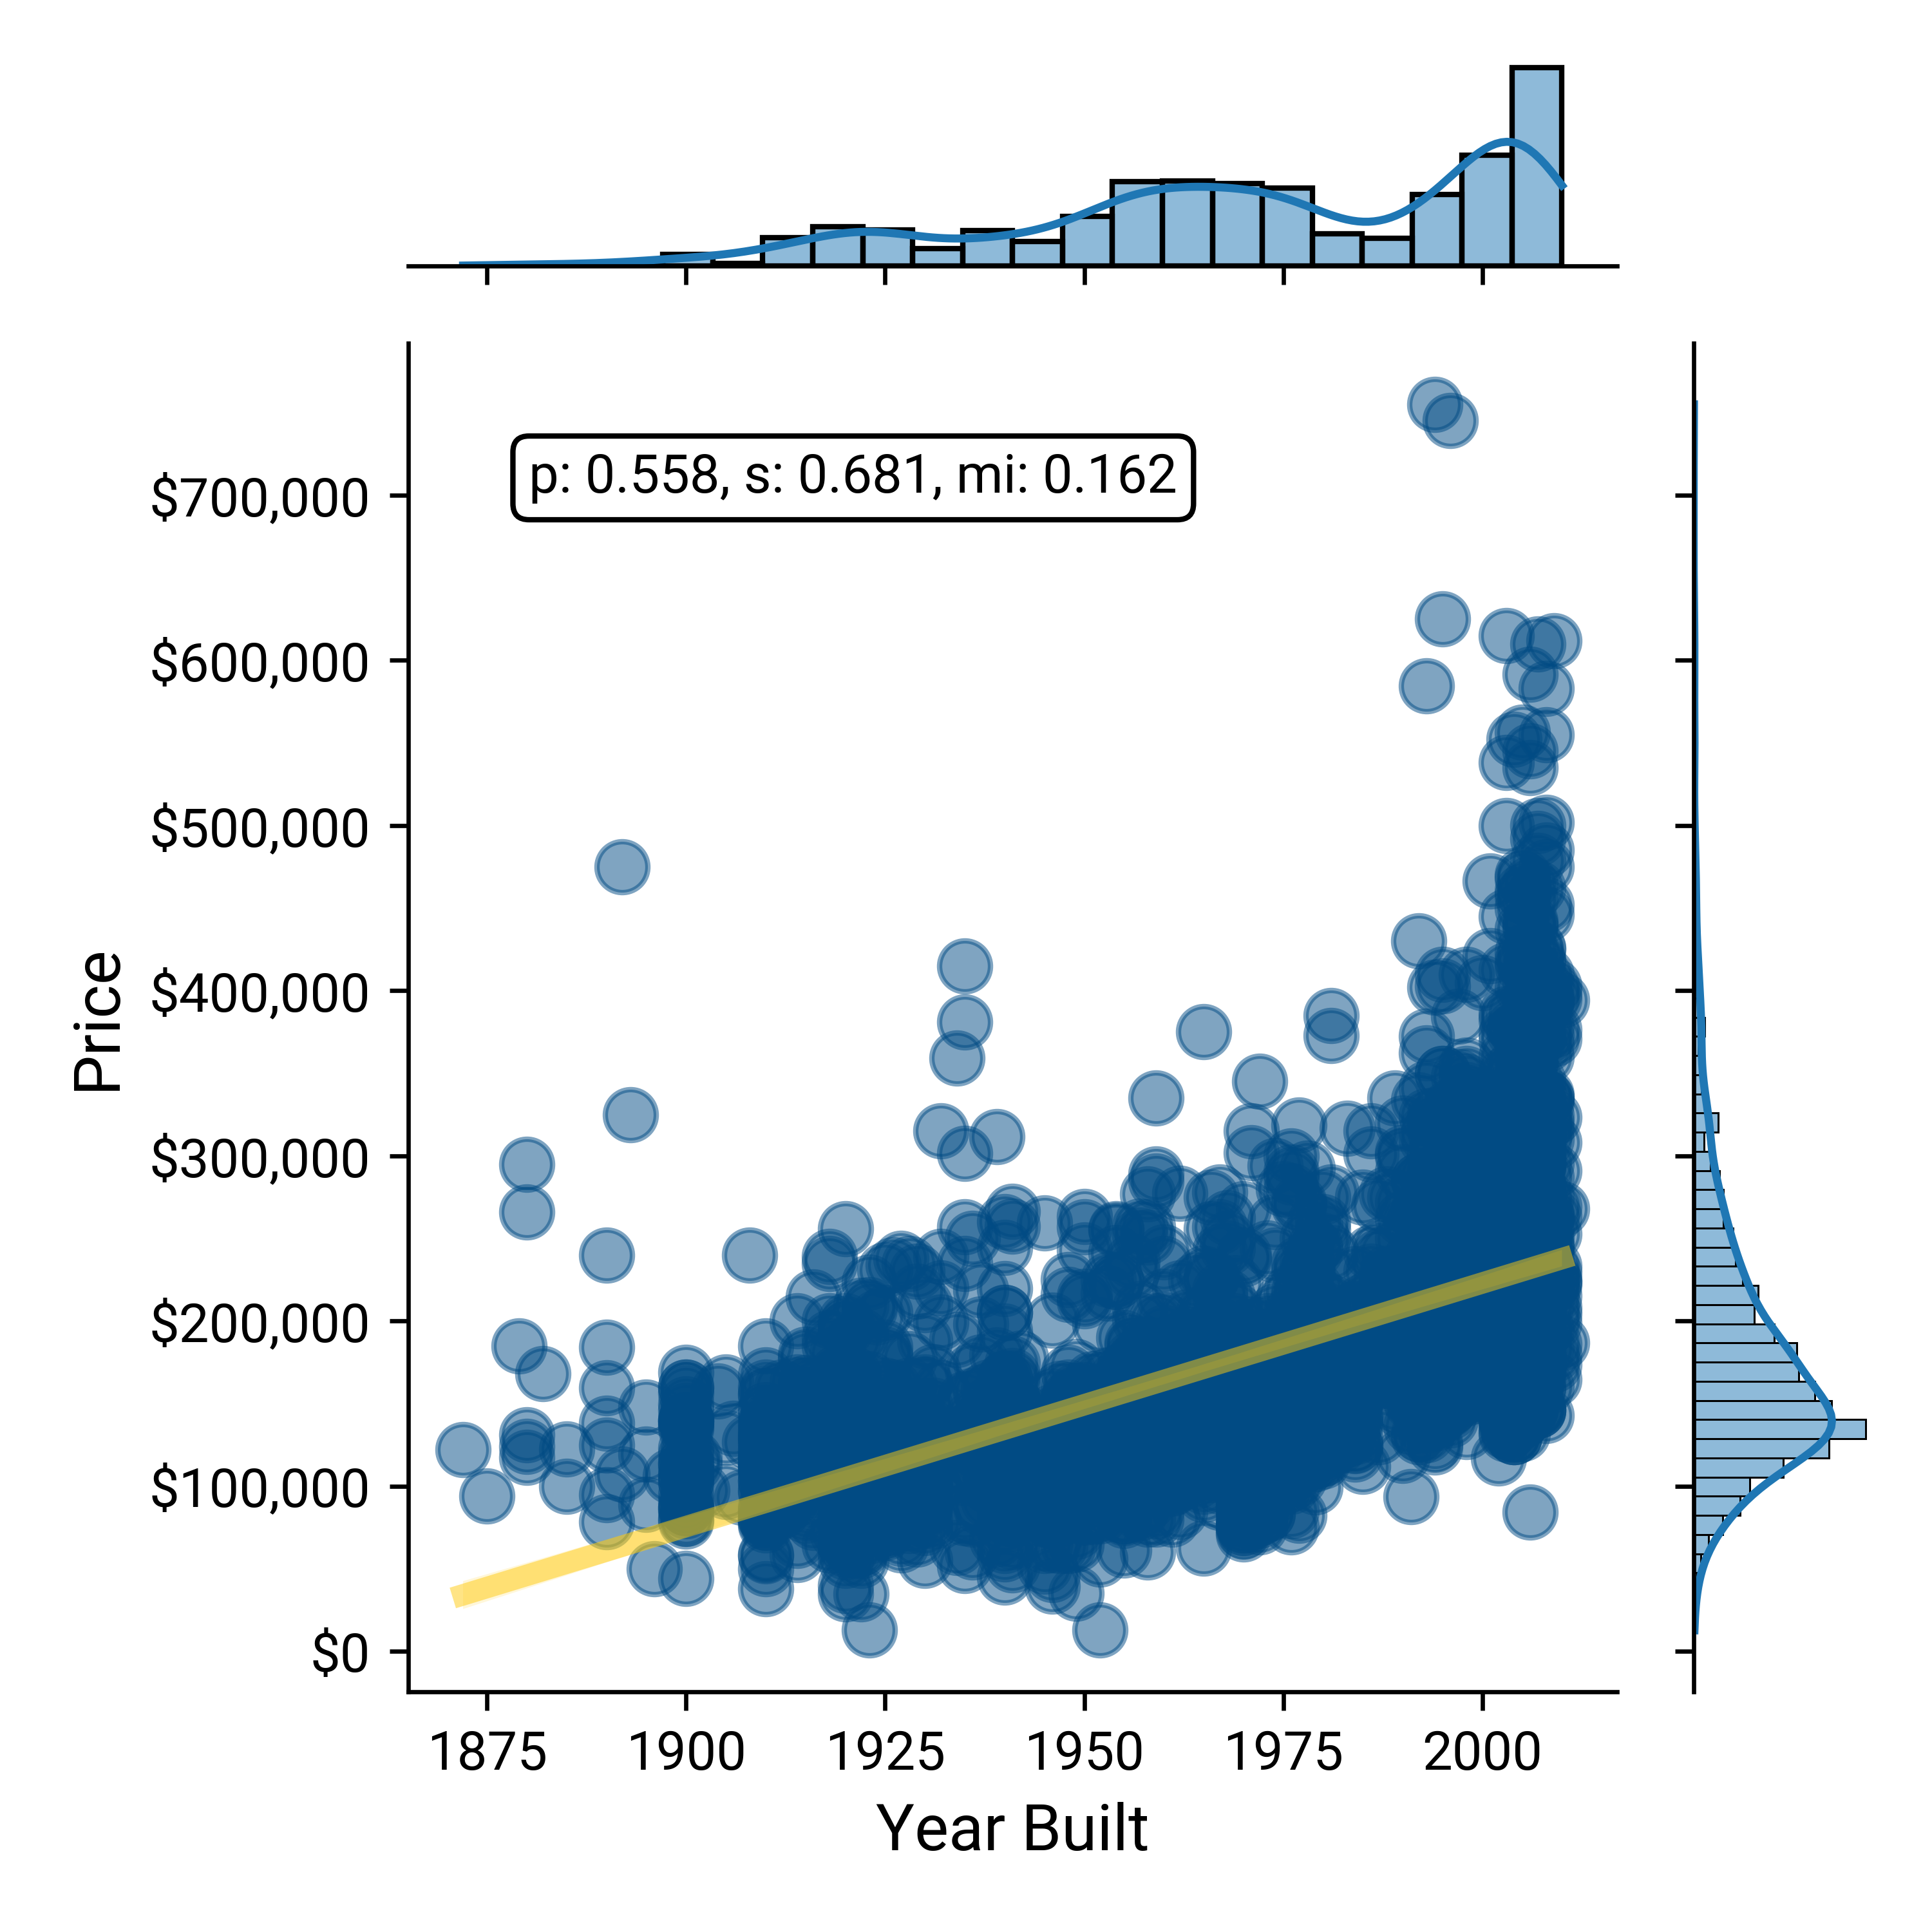
Source: De Cock, Dean. “Ames, Iowa: Alternative to the Boston housing data as an end of semester regression project.” Journal of Statistics Education 19.3 (2011)
Finally, the relationship between housing prices and the year of sale between 2006 and 2010 reveals almost no correlation at all (p=-.031). One might expect a slightly positive correlation due to inflation, but that doesn’t seem to bear out in Ames, Iowa (likely due to the “Great Recession” of 2008-2009). Houses of all prices (inexpensive and expensive) are sold every year, so only knowing the year a house is sold gives you little information about the price.
Home Price vs Year Sold in Ames, IA, 2006–2010
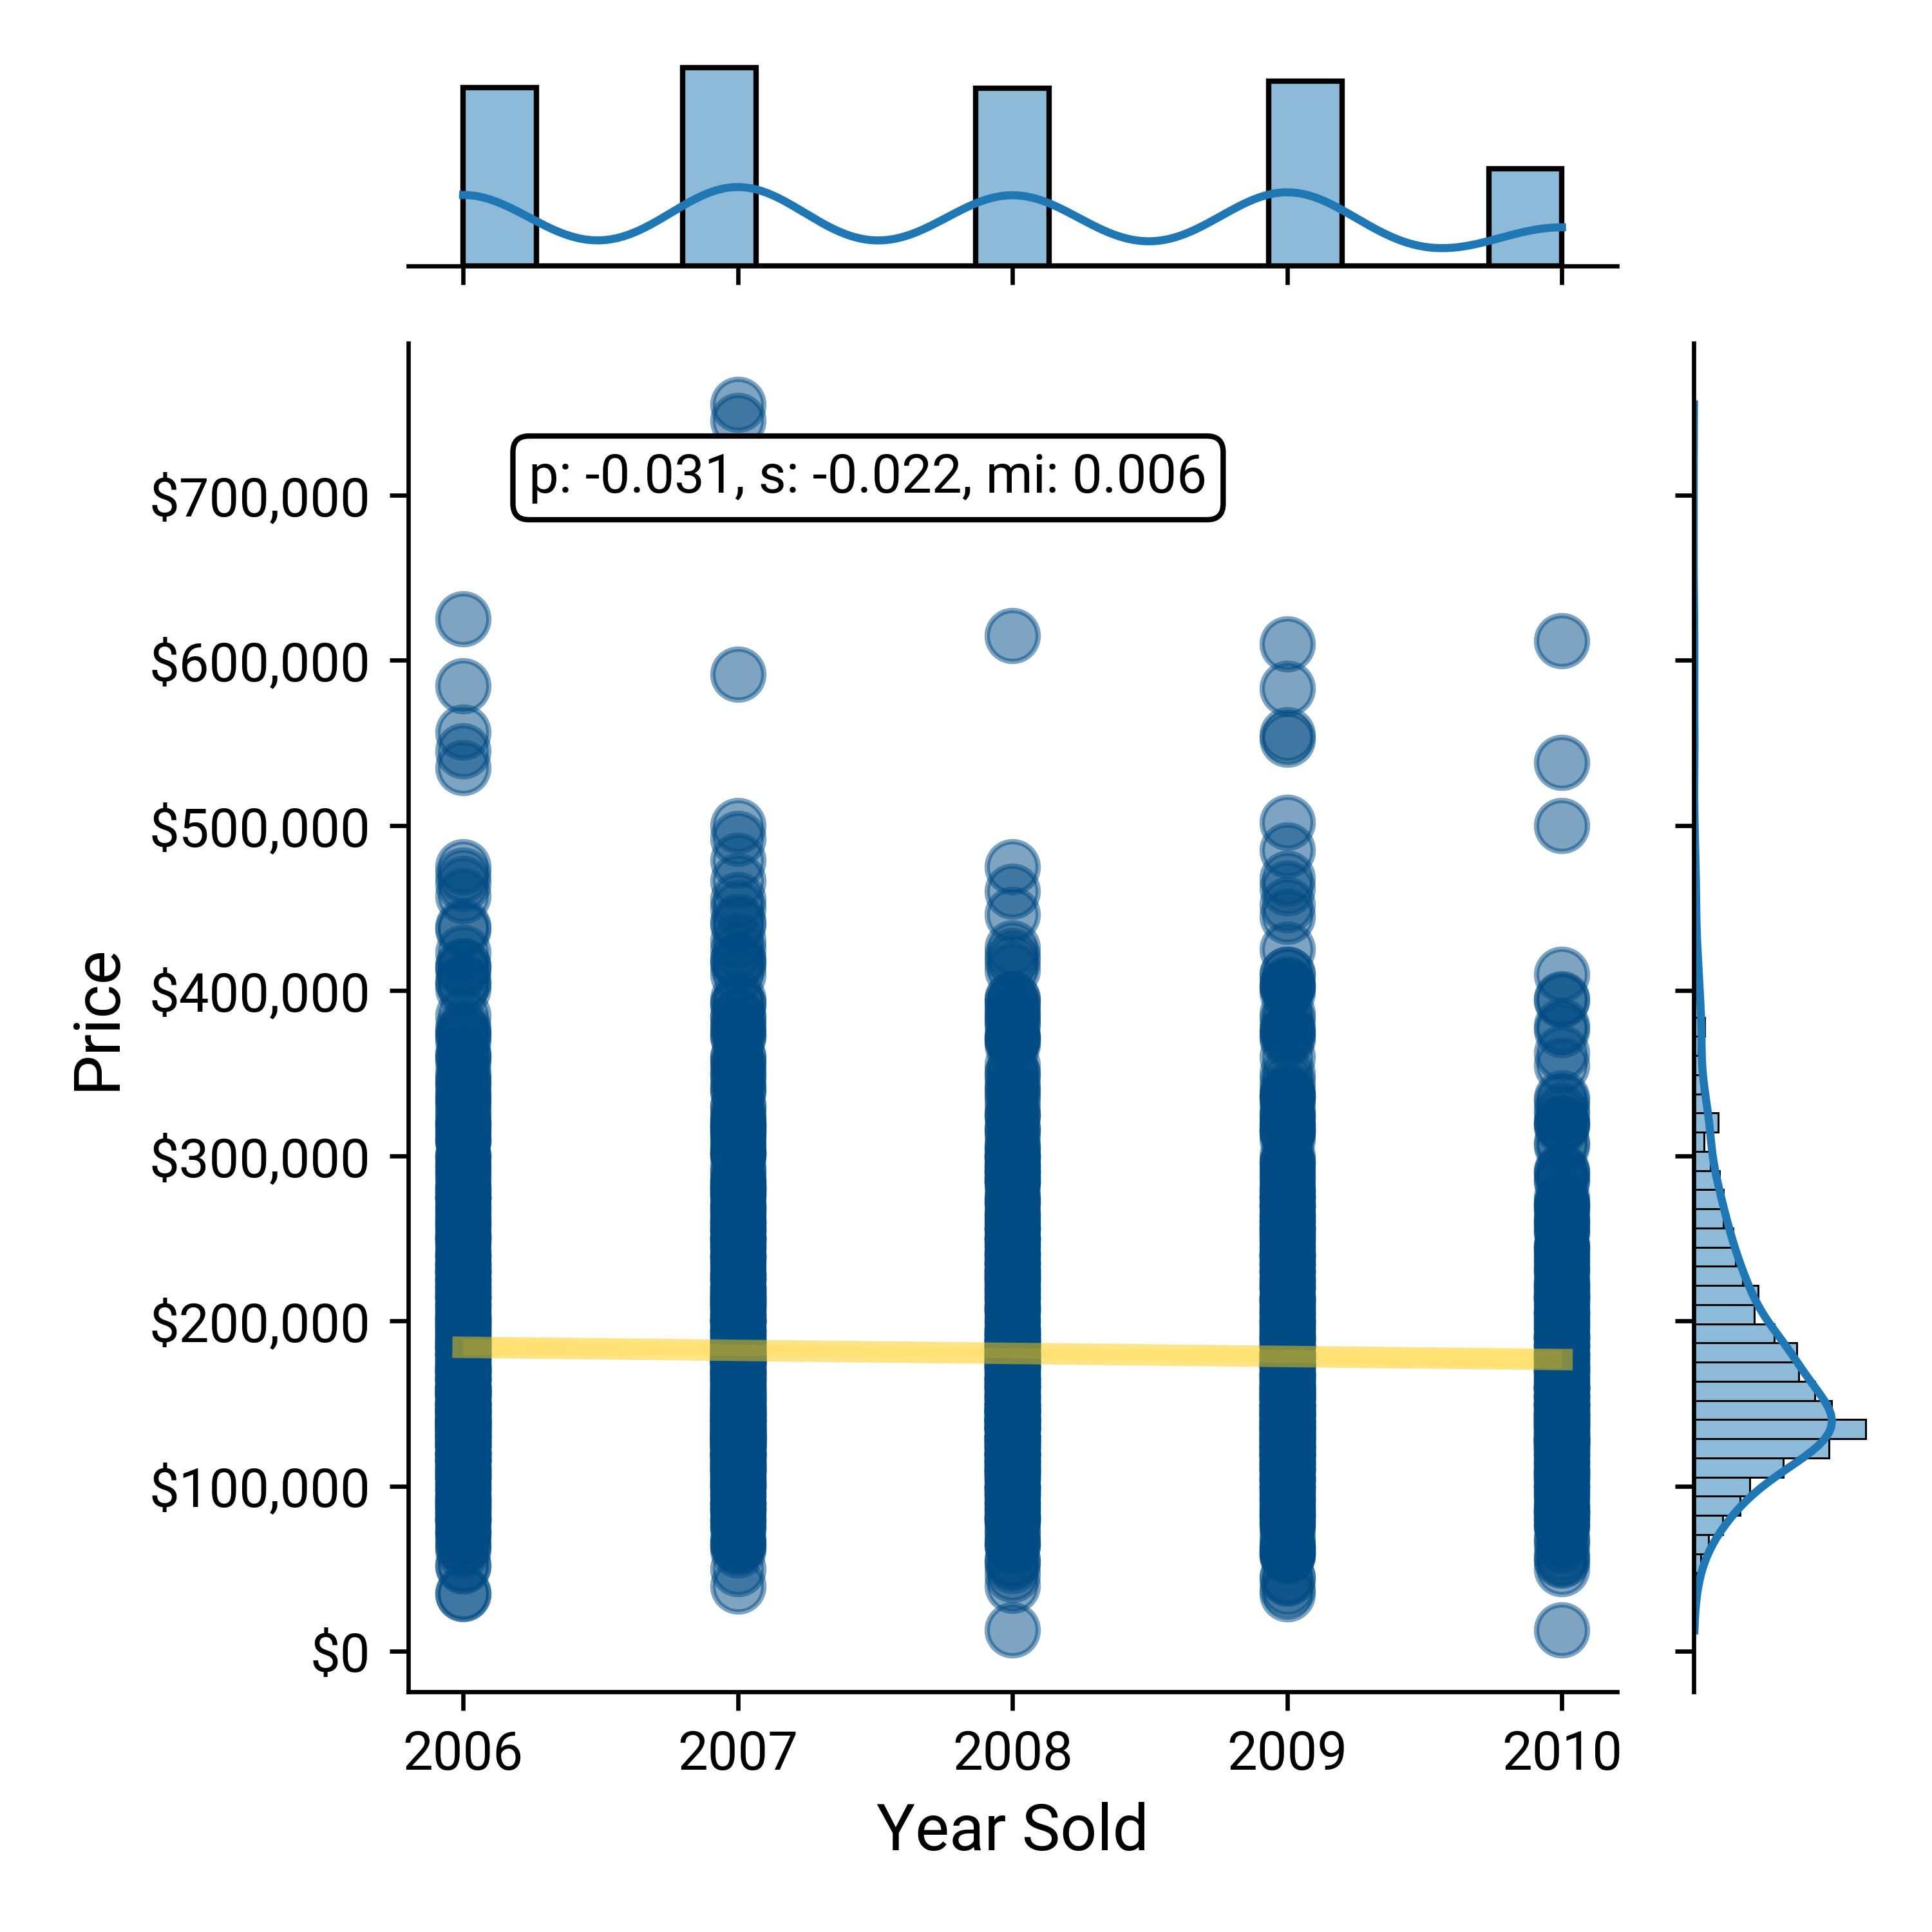
Source: De Cock, Dean. “Ames, Iowa: Alternative to the Boston housing data as an end of semester regression project.” Journal of Statistics Education 19.3 (2011)
It is axiomatic that “you get what you pay for,” and the analysis of housing data in Ames, Iowa seems to confirm that consumers get “more” – whether in square footage or newer construction – in exchange for a higher price.
Healthcare is a noticeable exception to the axiom since in healthcare customers and end users rarely know what they bought, what was delivered, what it cost or whether it was any good.
Using Pearson, Spearman and MI to compare common quality measures for high-volume hospital inpatient procedures and in-network reimbursement paid for those procedures reveals negligible correlation between cost and quality. In each of the correlation analyses below of in-network rate vs the applicable quality measure, the X-axis represents quality, where a lower number is better. As a result, in these correlation analyses, the ideal correlation would be -1, which would demonstrate that as the rate increases, so does quality. Conversely, a correlation of 1 would demonstrate that as rate increases, quality decreases. In each example below, the slope of the regression line is “good,” but the correlations are “weak.”
It is well established that septicemia is a serious and sometimes fatal condition that is expensive to treat.7 “A central line-associated bloodstream infection (CLABSI) is a laboratory-confirmed bloodstream infection not related to an infection at another site that develops within 48 hours of central line placement,” and “septicemia is an infection that occurs when bacteria enter the bloodstream and spread.” 8,9 Comparing the in-network negotiated rate for DRG 871 - Sepsis with CLASBI as a relevant measure of quality reveals a negligible correlation between price and quality.
Negotiated Rate for Sepsis vs CLASBI
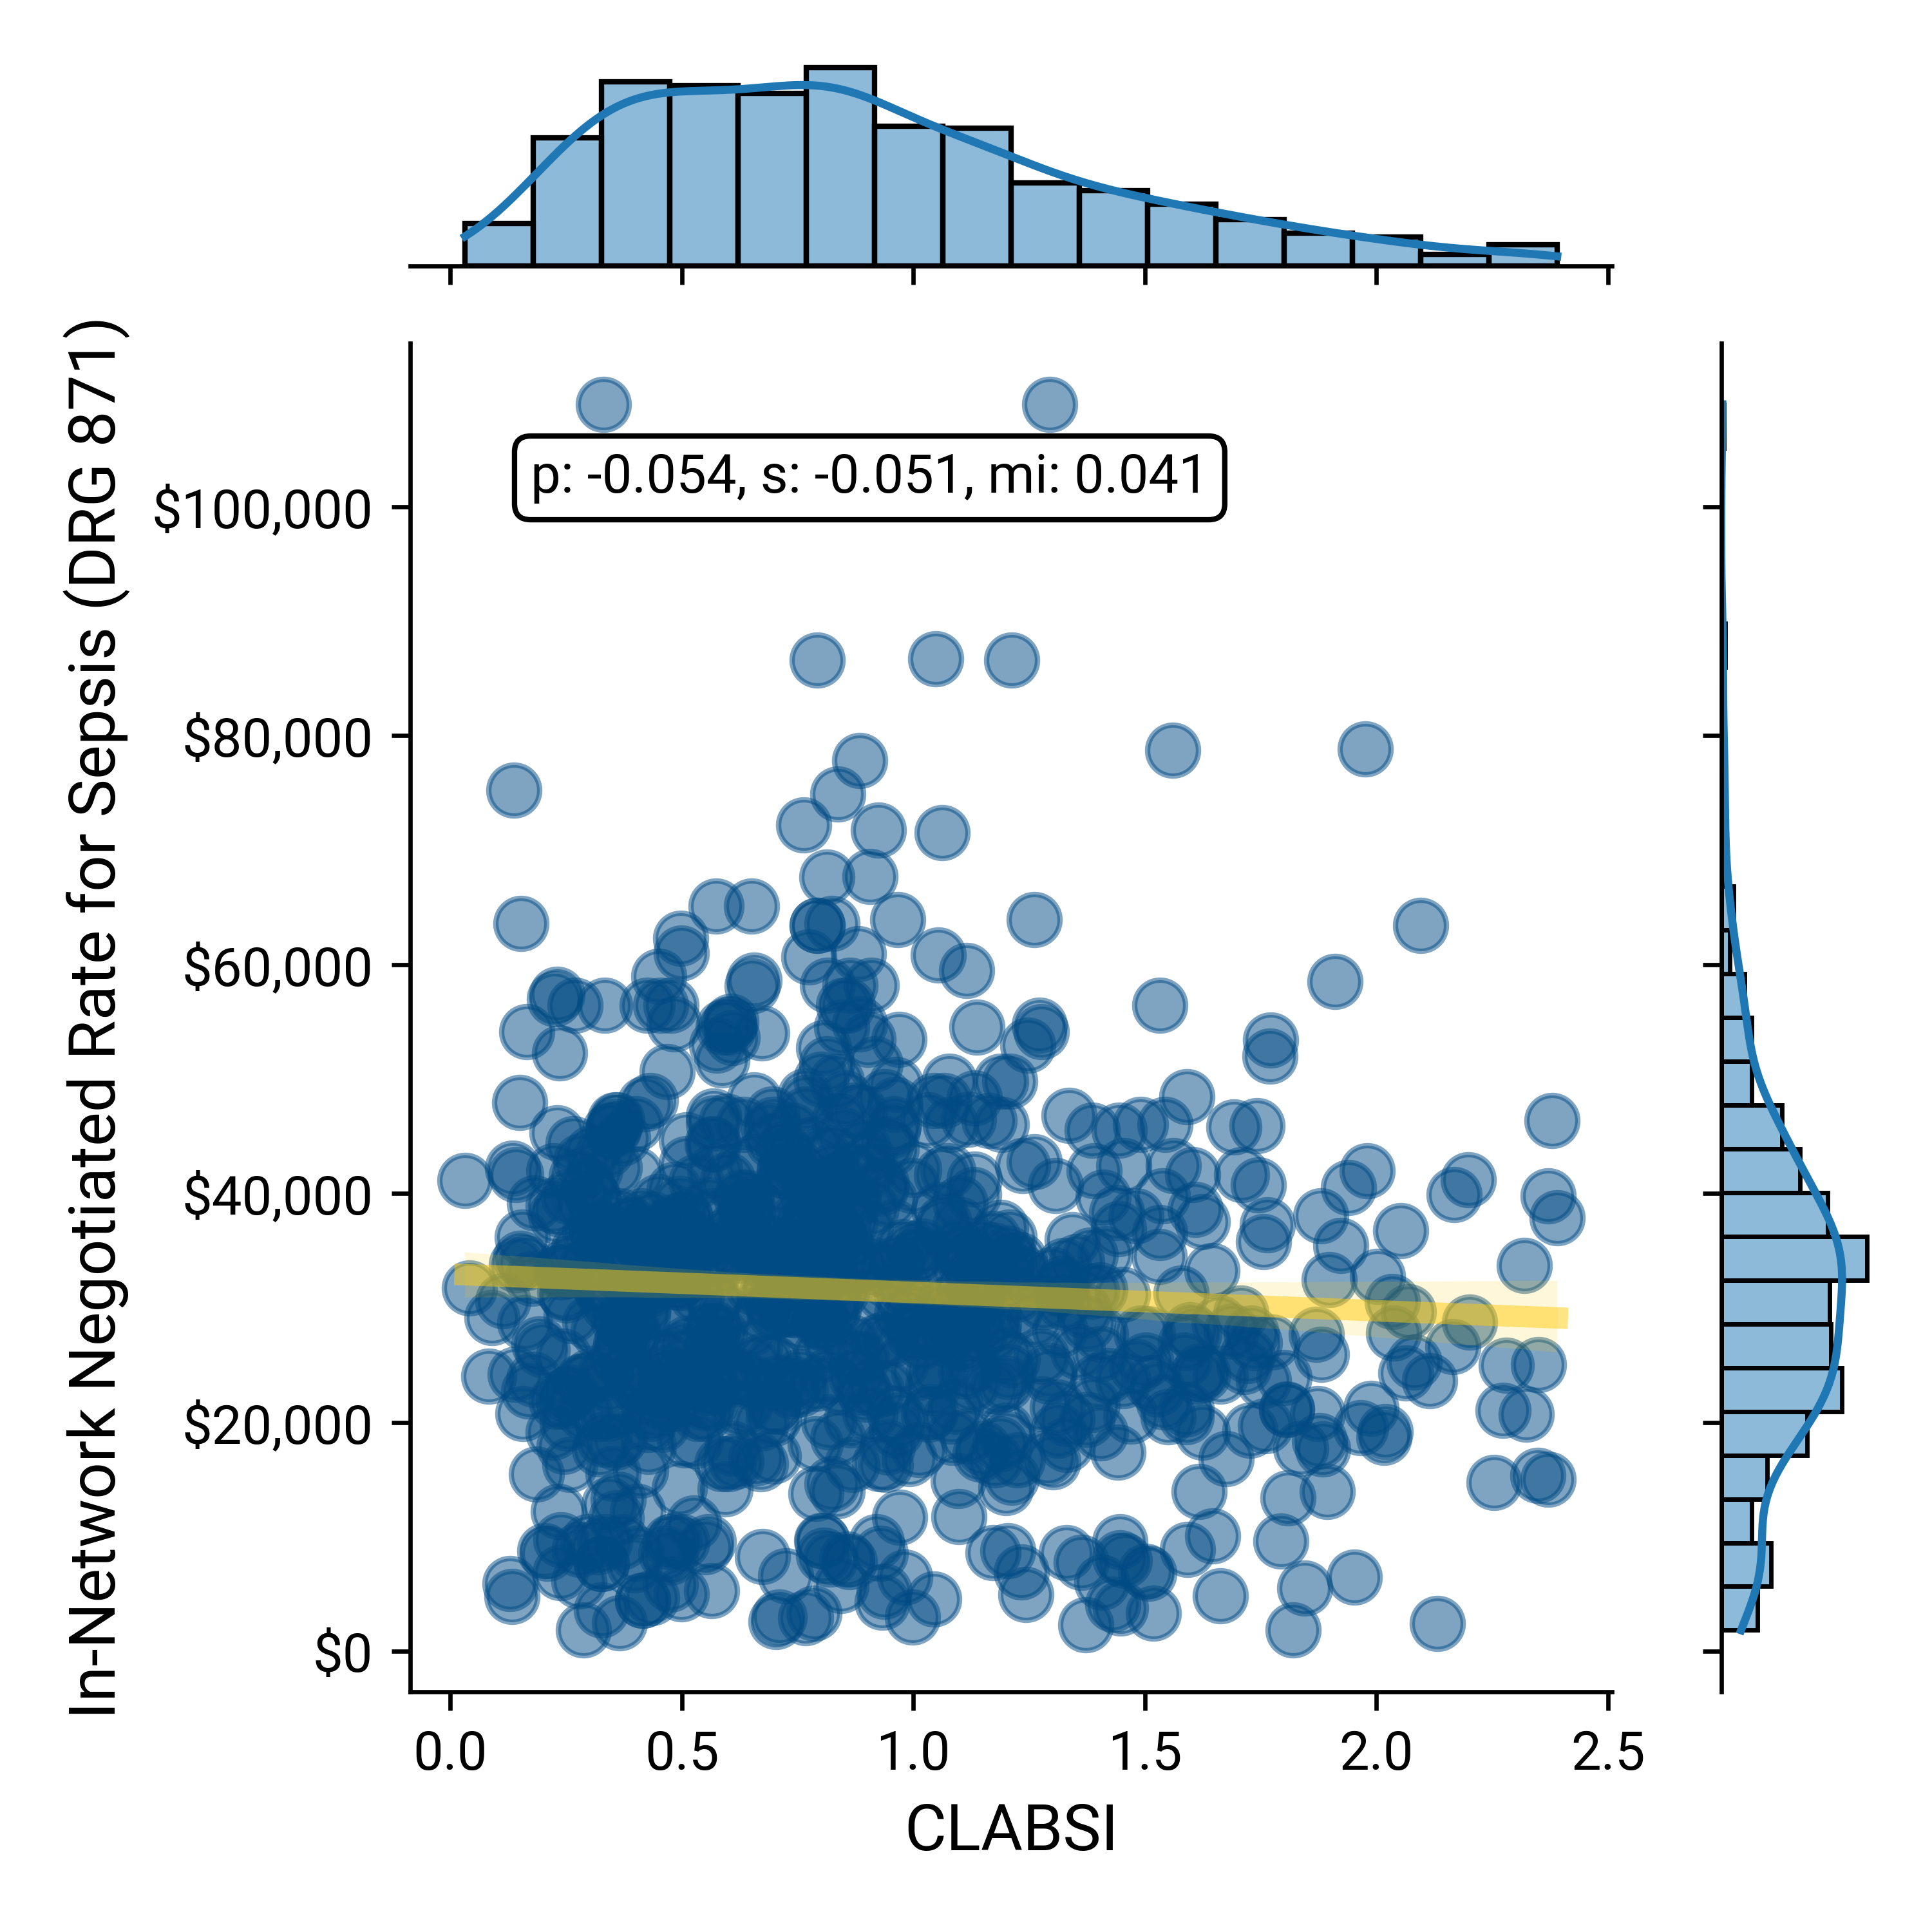
Source: Trilliant Health health plan price transparency dataset; CDC’s National Healthcare Safety Network (NHSN)
Similarly, comparing the in-network negotiated rates with the 30-day post-discharge mortality for DRG 190 – COPD, DRG 193 – Pneumonia, DRG 280 – Acute Myocardial Infarction and DRG 291 – Heart Failure, respectively, reveals a negligible correlation between price and quality.
Negotiated Rate vs 30-Day Mortality for COPD
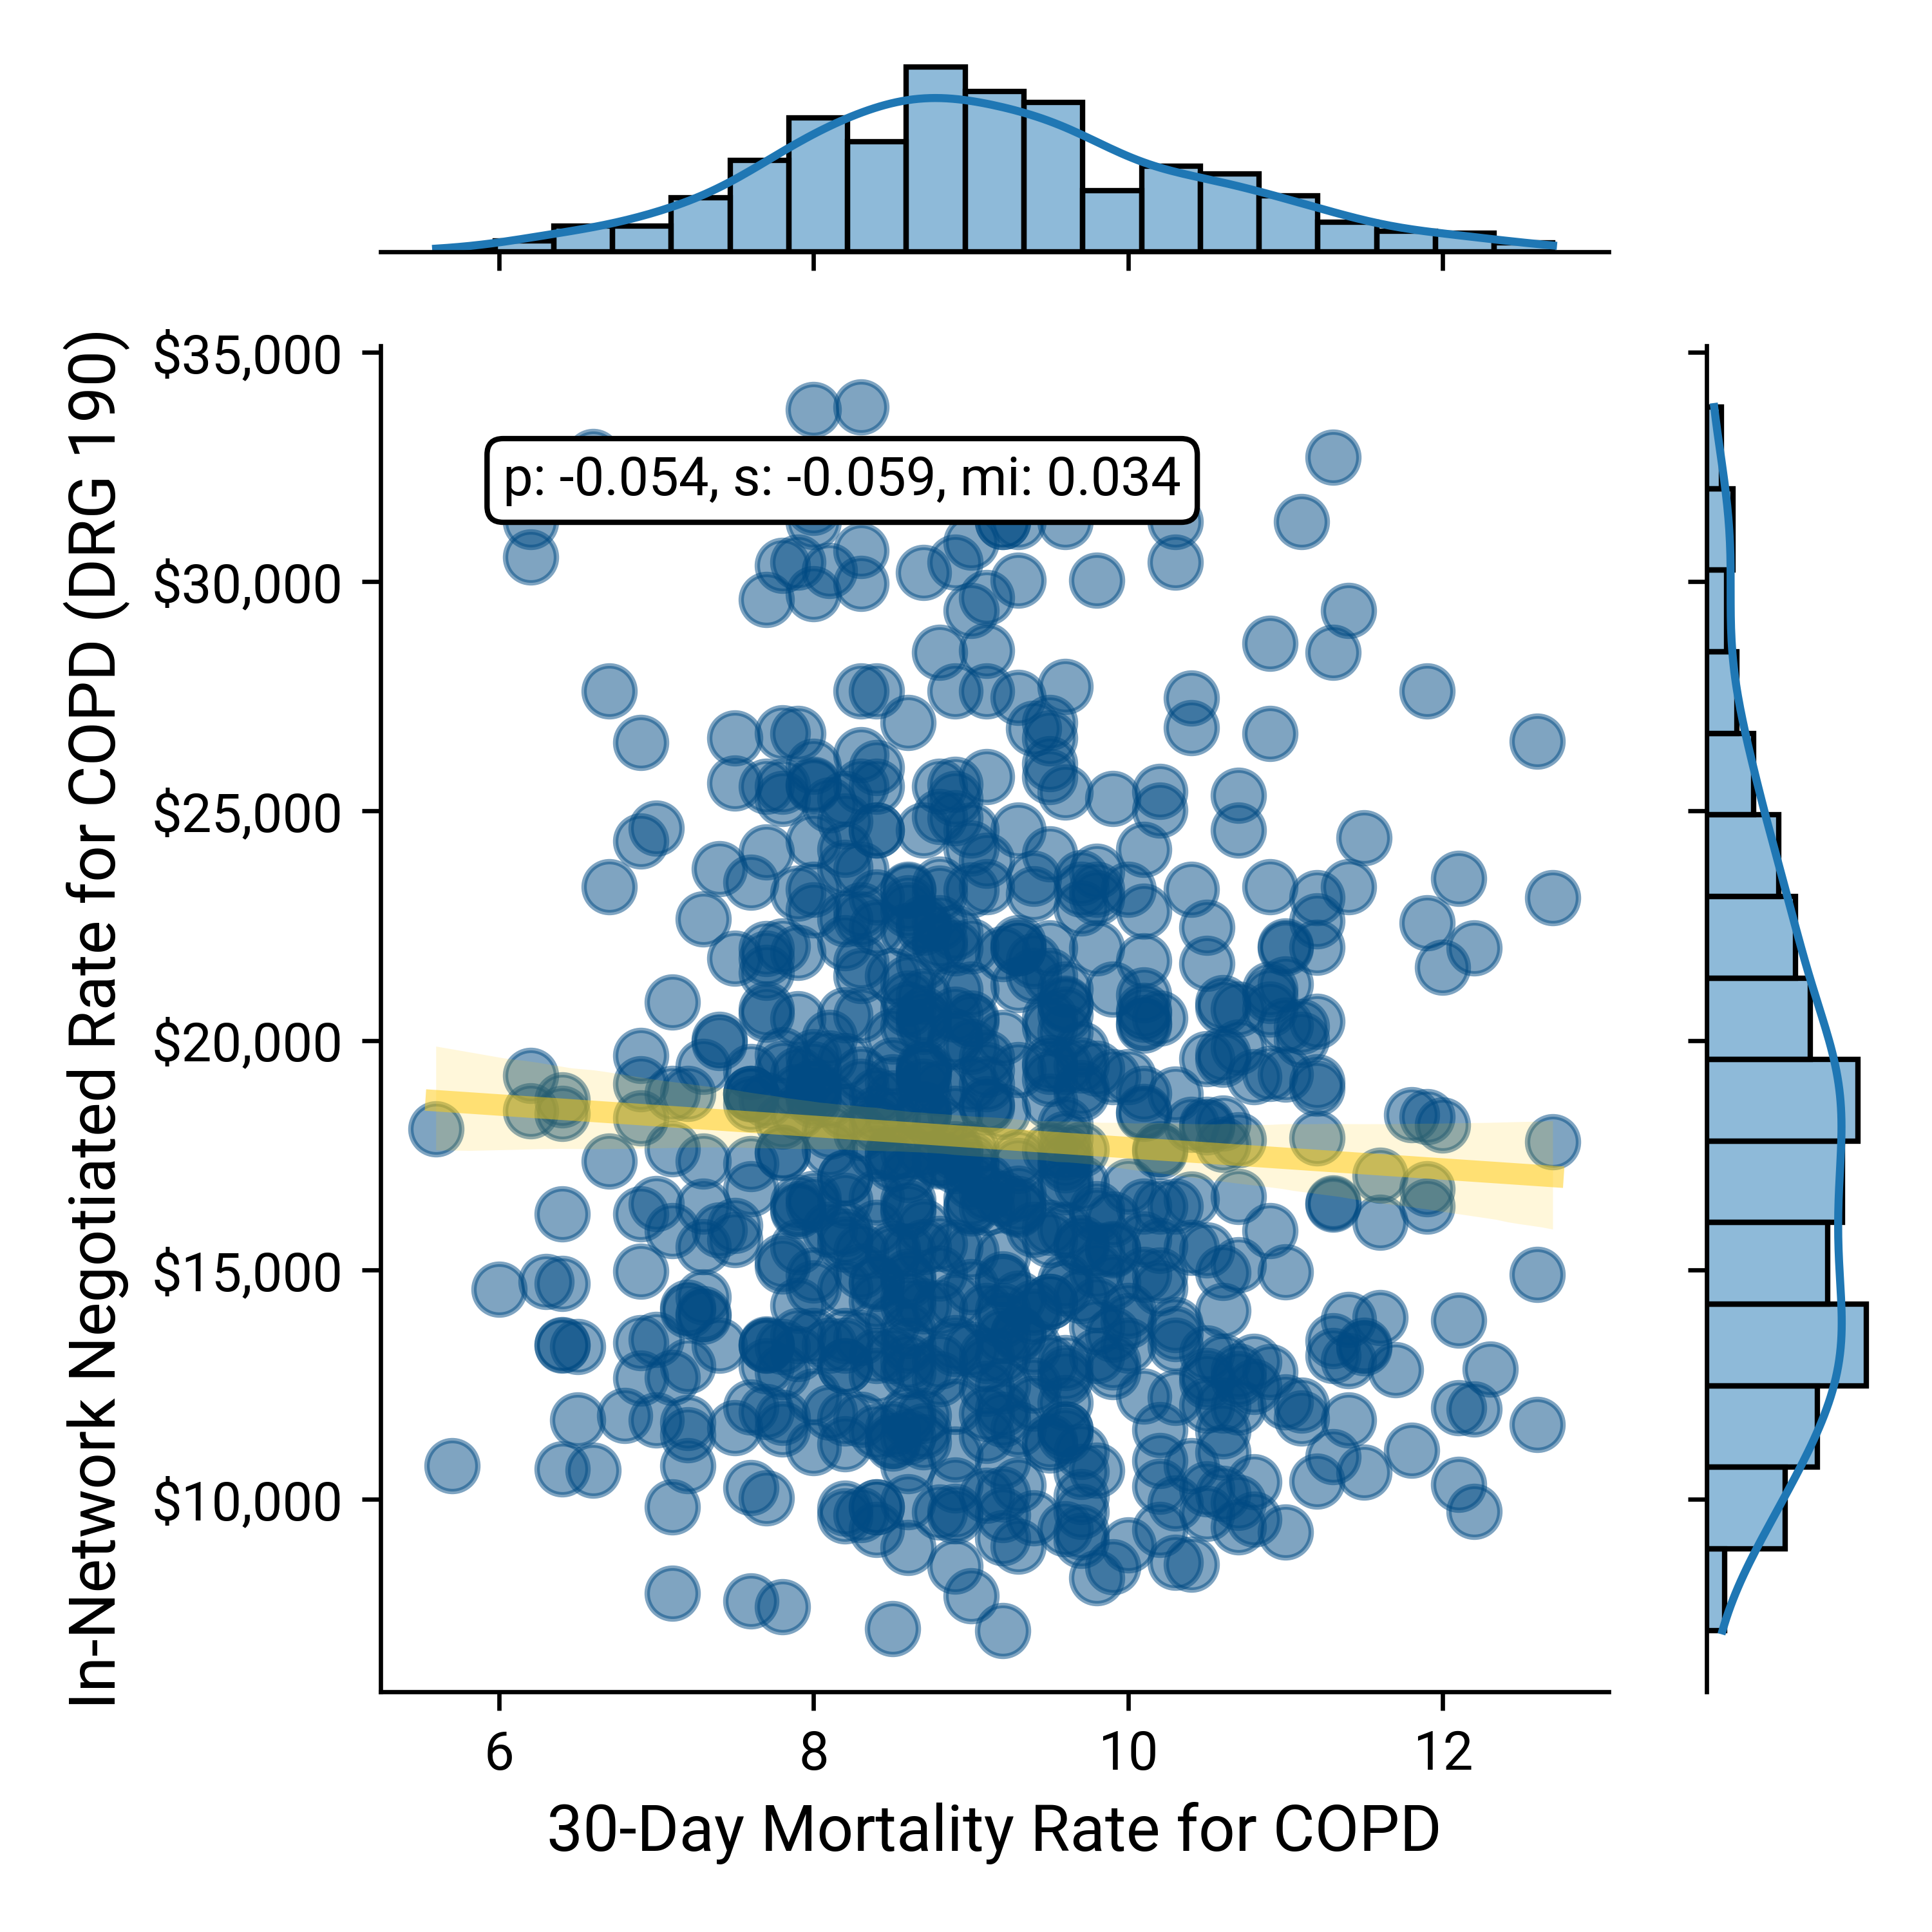
Source: Trilliant Health health plan price transparency dataset dataset; CMS QualityNet
Negotiated Rate vs 30-Day Mortality for Pneumonia
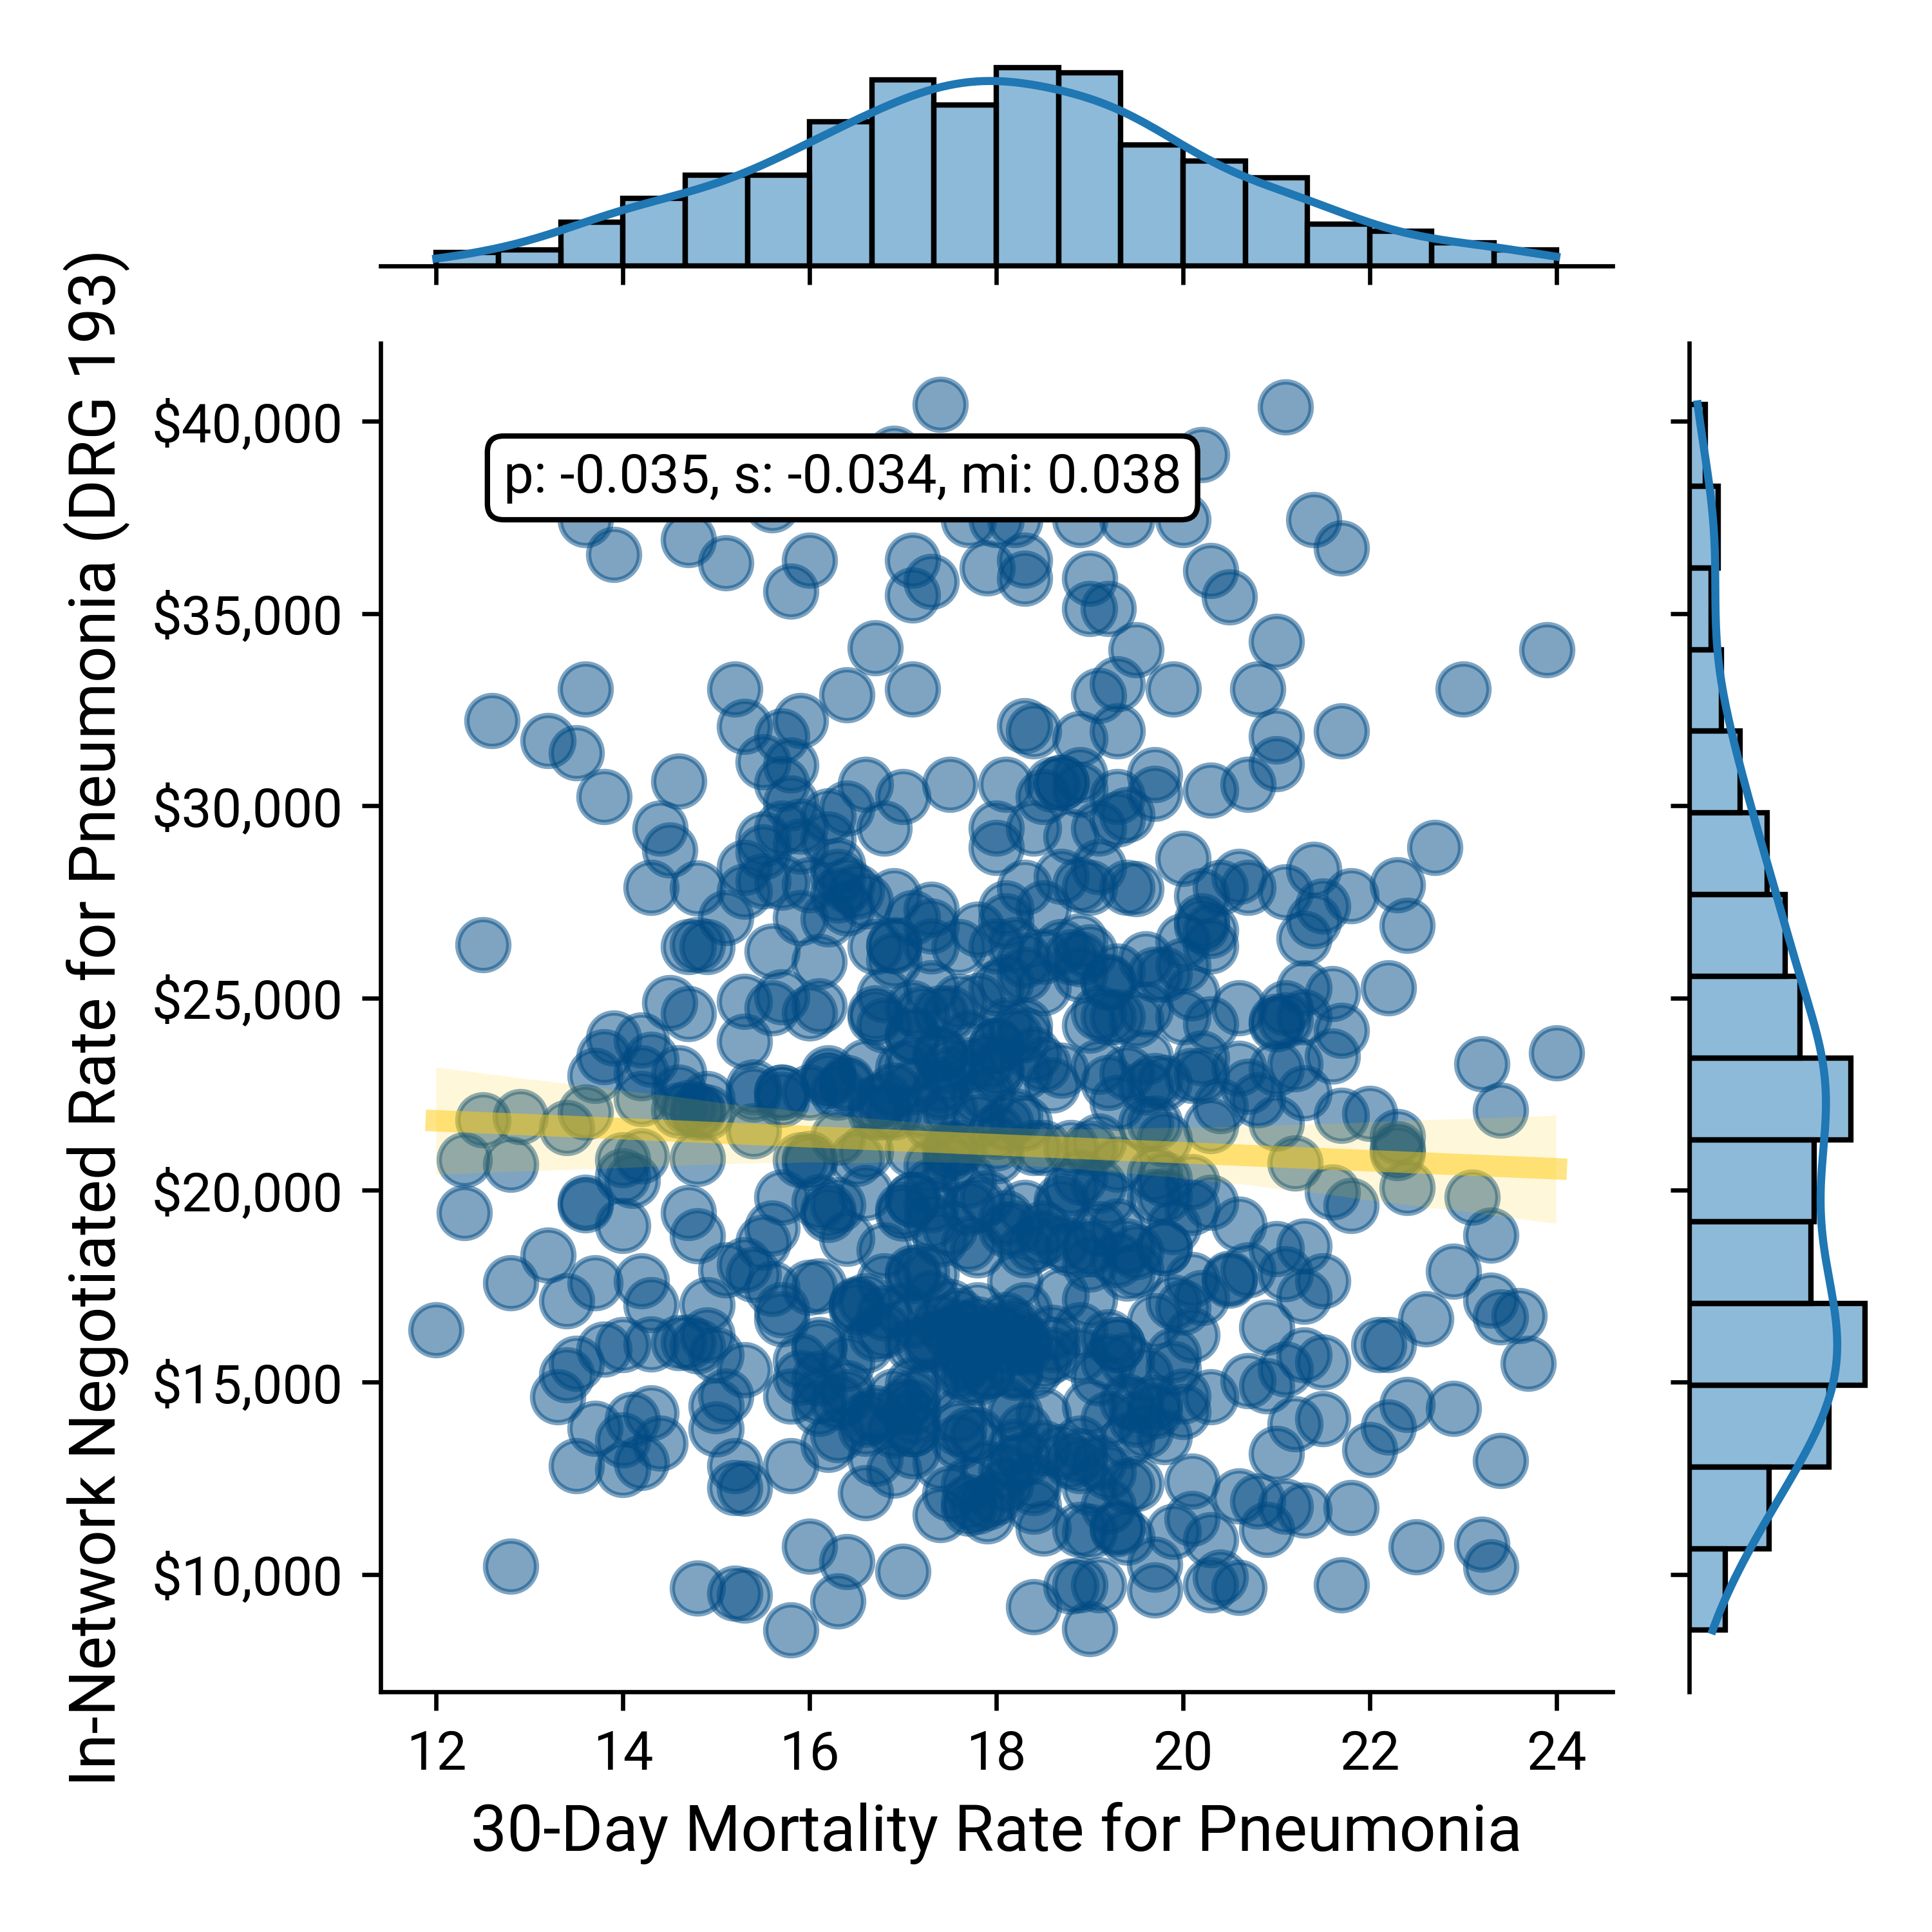
Source: Trilliant Health health plan price transparency dataset; CMS QualityNet
Negotiated Rate vs 30-Day Mortality for AMI
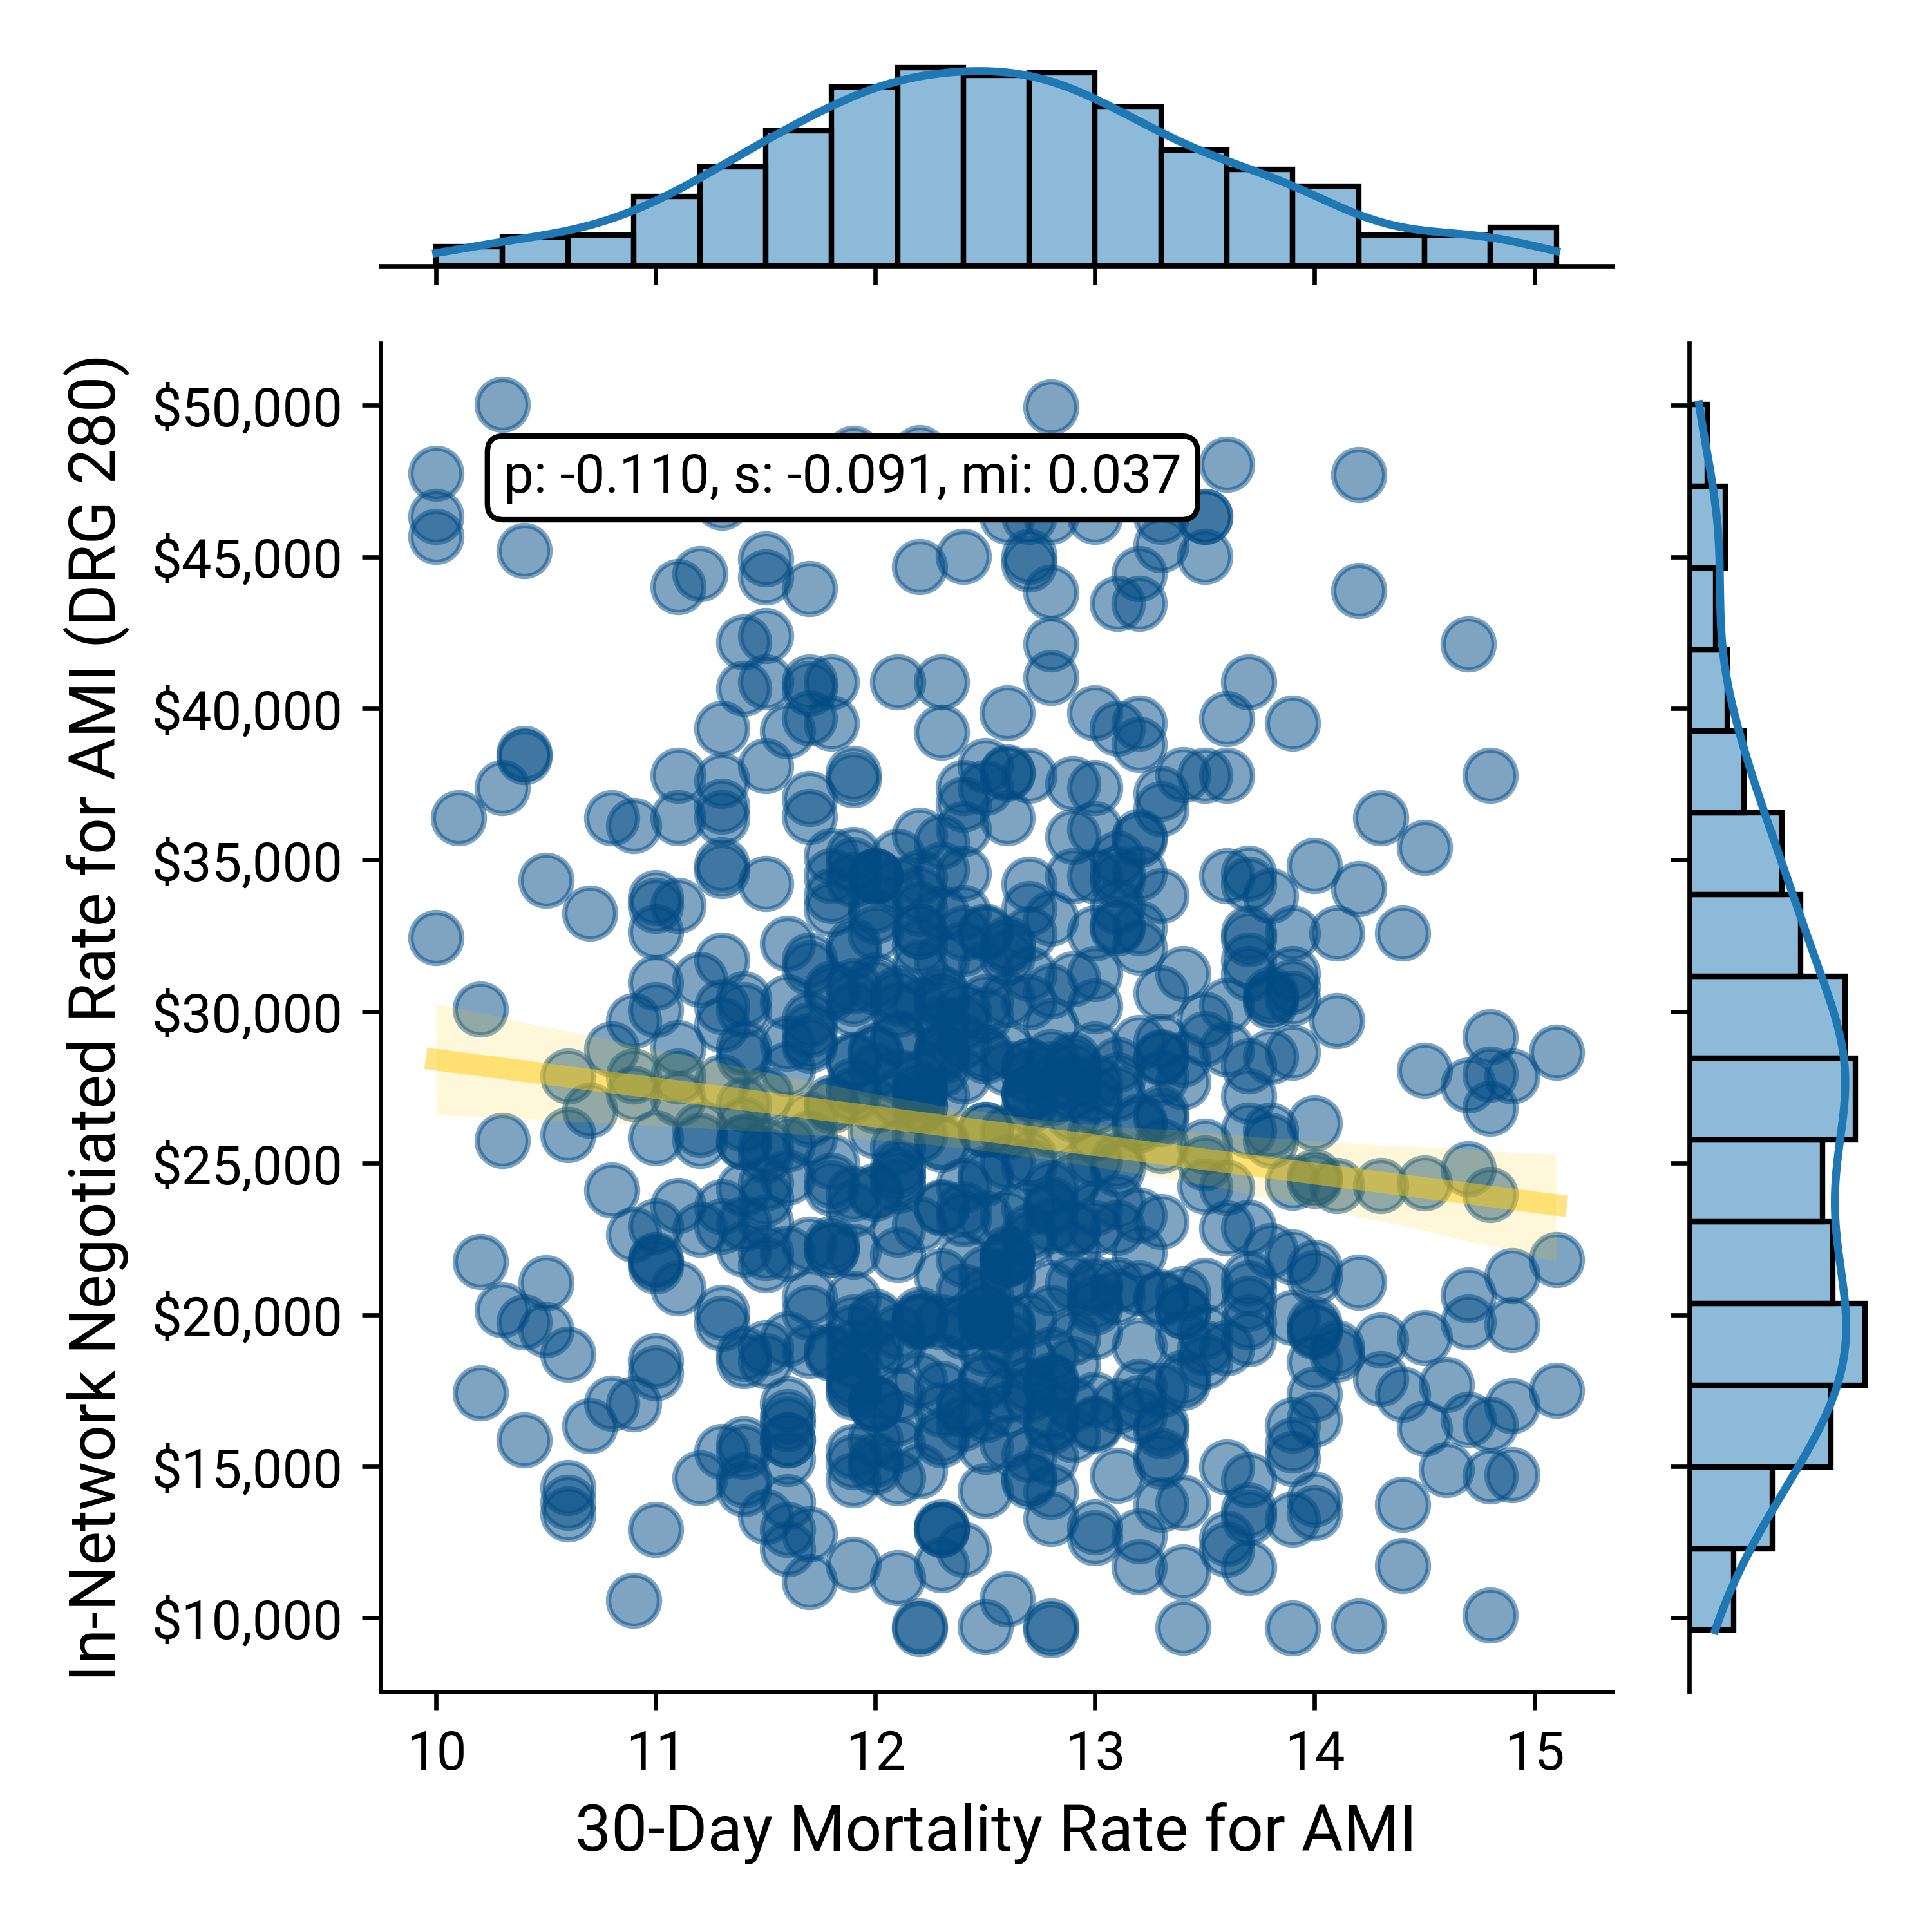
Source: Trilliant Health health plan price transparency dataset; CMS QualityNet
Negotiated Rate vs 30-Day Mortality for Heart Failure
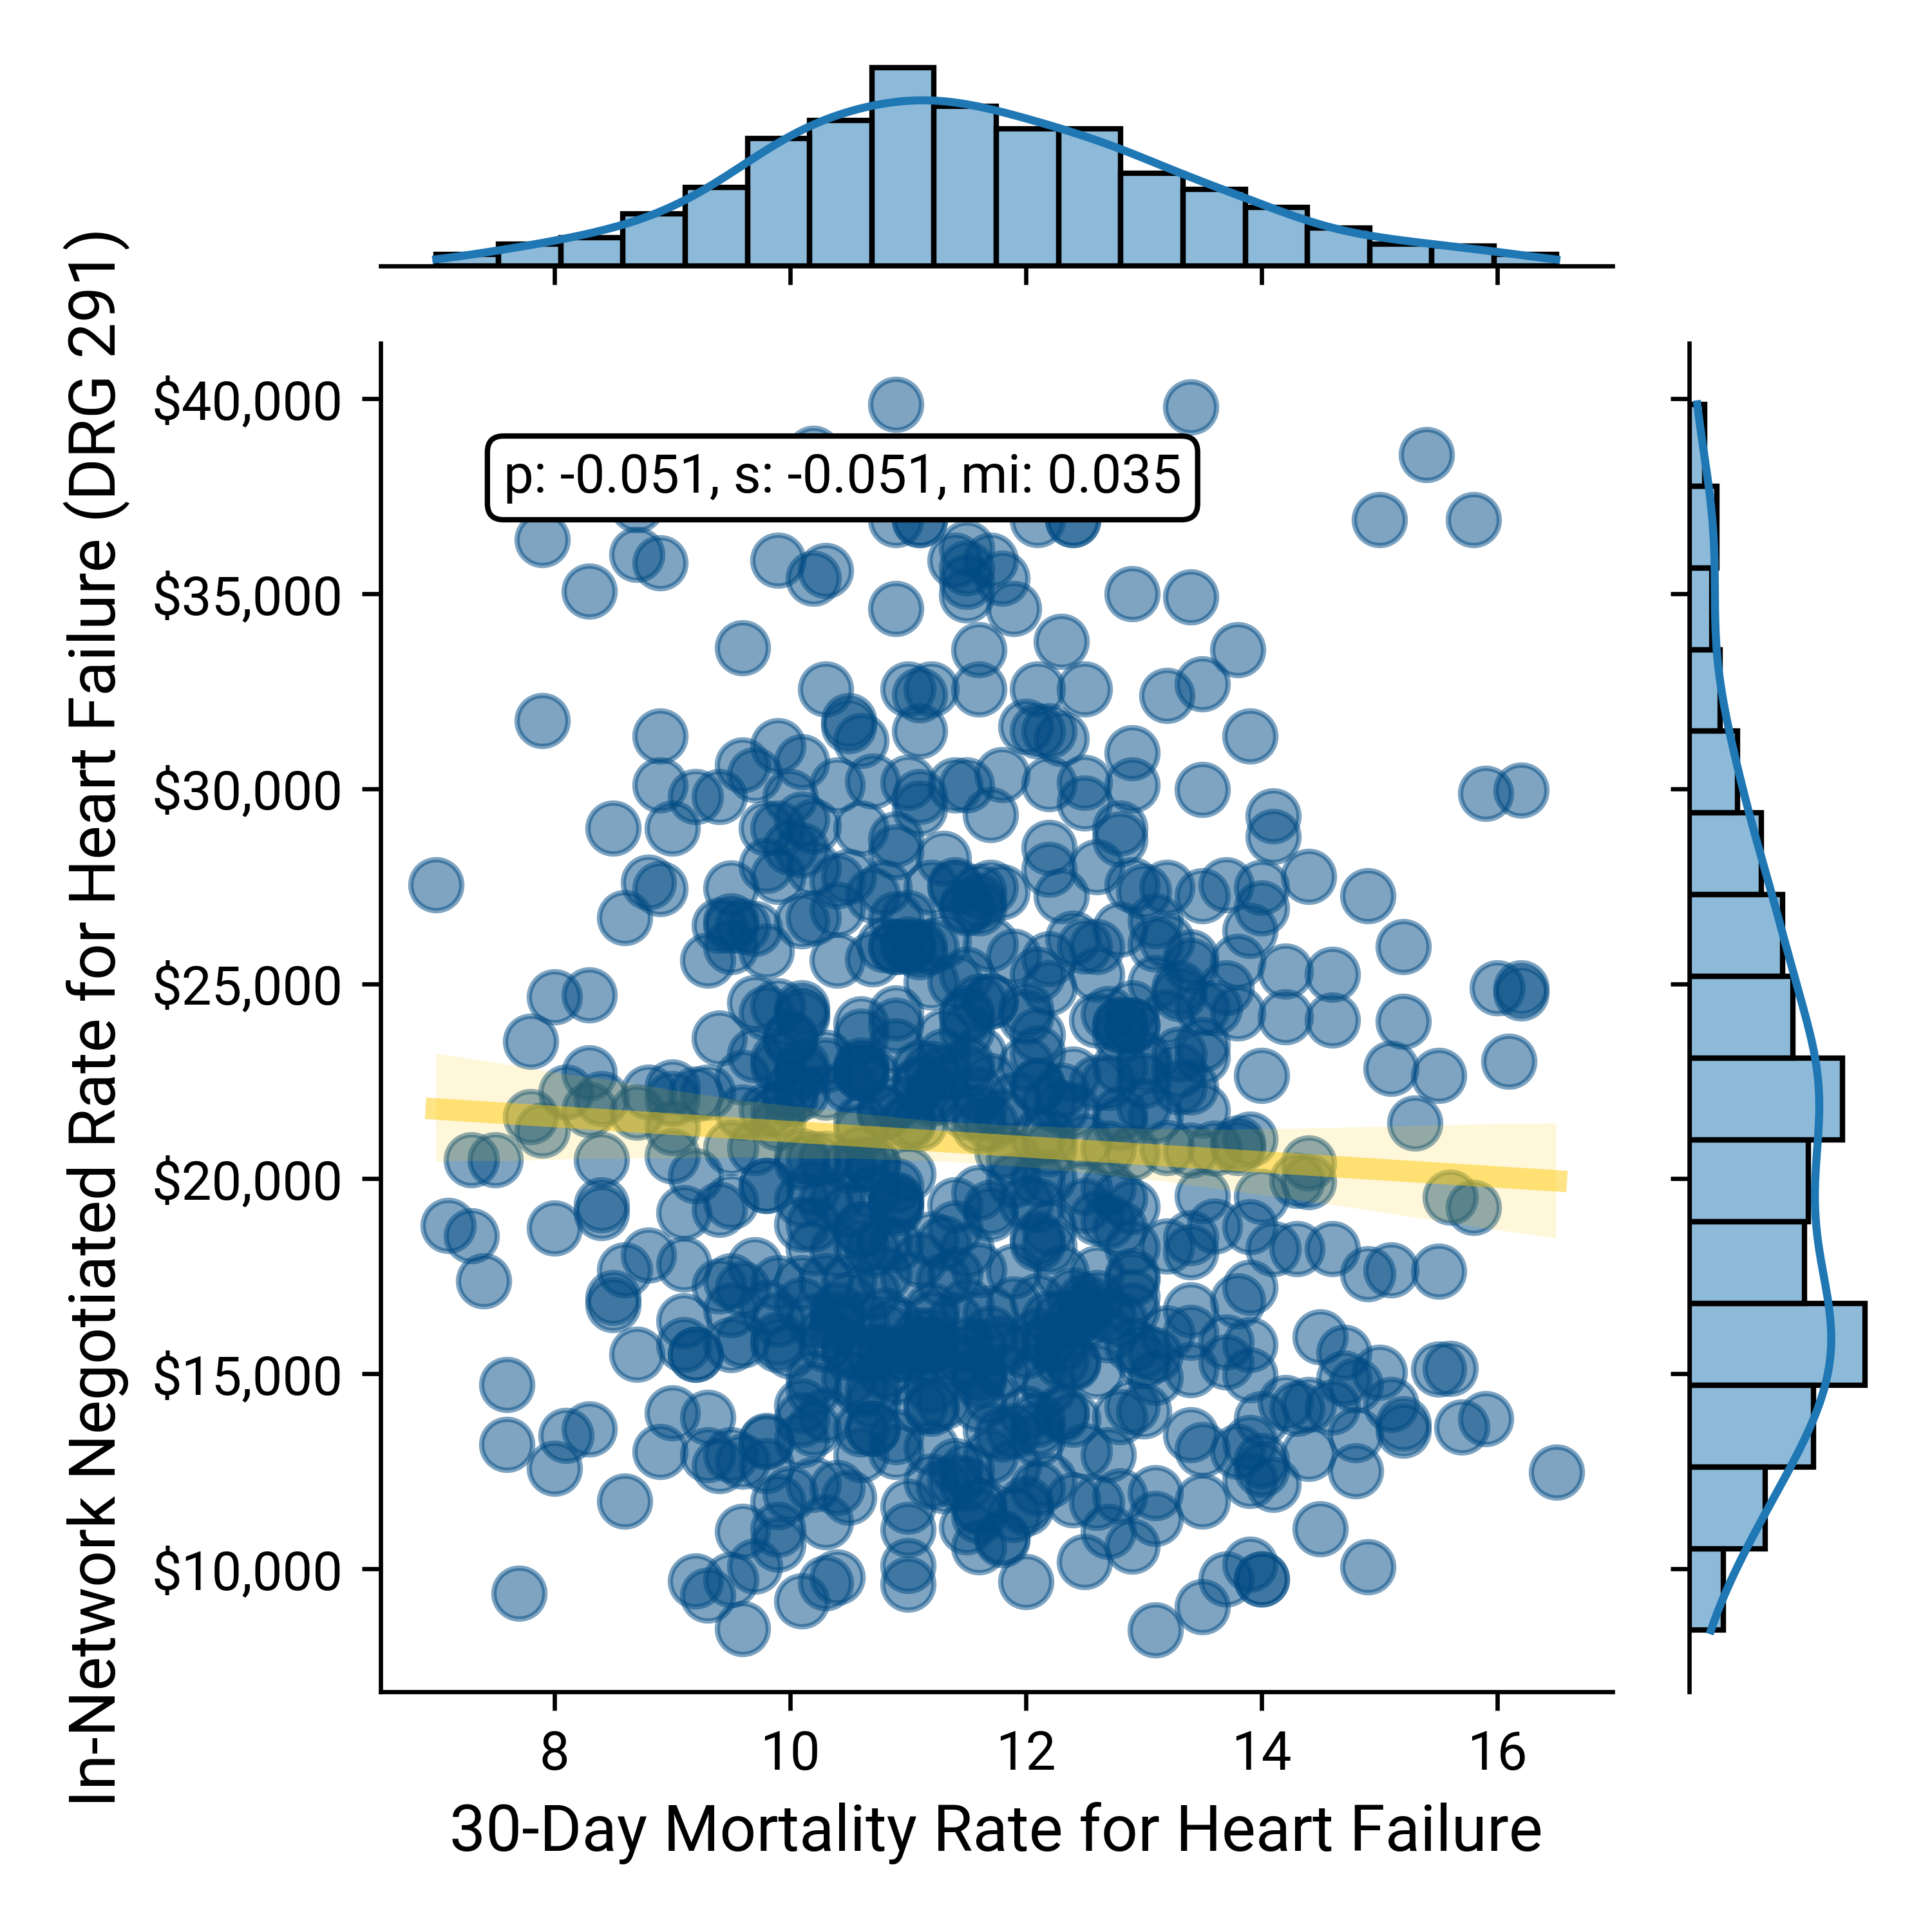
Source: Trilliant Health health plan price transparency dataset; CMS QualityNet
Creating Value for Money for Your Customer
Primum non nocere – first, do no harm – is a foundational concept in medicine, if not part of the Hippocratic Oath.10 The avoidance of harm is also foundational to delivering value for money.
According to the World Health Organization,
“It is estimated that there is a 1 in 3 million risk of dying while travelling by airplane. In comparison, the risk of patient death occurring due to a preventable medical accident, while receiving health care, is estimated to be 1 in 300.”11
The quality performance depicted above is depressingly dismal in aggregate, and stakeholders could dramatically increase the value for money in the U.S. health economy solely by reducing mortality.
Beyond improvements in the foundational quality elements of mortality and safety, analyzing in-network rates versus quality measures reveals hundreds of examples in which the same quality outcome can be obtained at a wide variety of rates. In each such case, value for healthcare products and services is completely dependent on comparative reimbursement rates rather than quality.
Health plan price transparency reveals a startling spread in pricing for healthcare services that begs for explanation, not rationalization or justification. As a result, health plan price transparency should inaugurate an era of unprecedented and frenzied competition to win the hearts and minds of the payer that keeps the current U.S. healthcare system afloat: the employer. If it does, the winners in healthcare’s negative-sum game will be those who deliver value for money.
Having identified the true customer for every health economy stakeholder, we will now review how to develop evidence-based strategies to deliver value for money.
Footnotes
-
Exchange Coverage Remains Near Record High as 23.1 Million Enroll in 2026 ↩
-
Medicare Advantage Enrollment Grew by About 1 Million People, Mainly Due to Special Needs Plans ↩
-
Origins and Evolution of Employment-Based Health Benefits - Employment and Health Benefits - NCBI Bookshelf (nih.gov) ↩
-
Numeracy, Maths and Statistics - Academic Skills Kit (ncl.ac.uk) ↩
-
Epidemiology and Costs of Sepsis in the United States—An Analysis Based on Timing of Diagnosis and Severity Level* - PMC (nih.gov) ↩
-
Central Line–Associated Blood Stream Infections - StatPearls - NCBI Bookshelf (nih.gov) ↩