Chapter 1: Market Share
Why Market Share Matters for Every Health Economy Stakeholder
Market share is the most important metric of winning – or losing – in any competitive market. Measuring market share accurately is a best practice in a positive-sum market; it is mission-critical in a negative-sum market.
In healthcare, market share reveals a stakeholder’s network performance and, in turn, the effectiveness of its strategic initiatives and operational execution. Every individual interaction between a patient and a physician affects the network performance of every health economy stakeholder, whether they know it or not. Physicians make referrals to other physicians or facilities, or not, and those referrals are made to “in-network” participants, or not. Physicians write follow-up orders or prescriptions, or not, and patients follow them, or not. A surgeon implants a manufacturer’s device, or not.
As a result, the U.S. health economy is simply the aggregation of the millions of physician and patient decisions that are made, or not, every day. Every health economy stakeholder’s network performance depends on how many of those decisions were favorable to their business model, or not.
What Health Economy Stakeholders Are Doing Wrong, and Why
Competing effectively is impossible without understanding your competitors and their market share – who they are, where they operate and how much business they have. Therefore, measuring market share accurately requires knowing the number of competitors in the target market.
The first thing to know about market share in the health economy is this:
Every health economy stakeholder fundamentally misunderstands market share because none of them know how many competitors exist.
Evaluation and Management (E&M) Visit Market Share in Los Angeles, CA
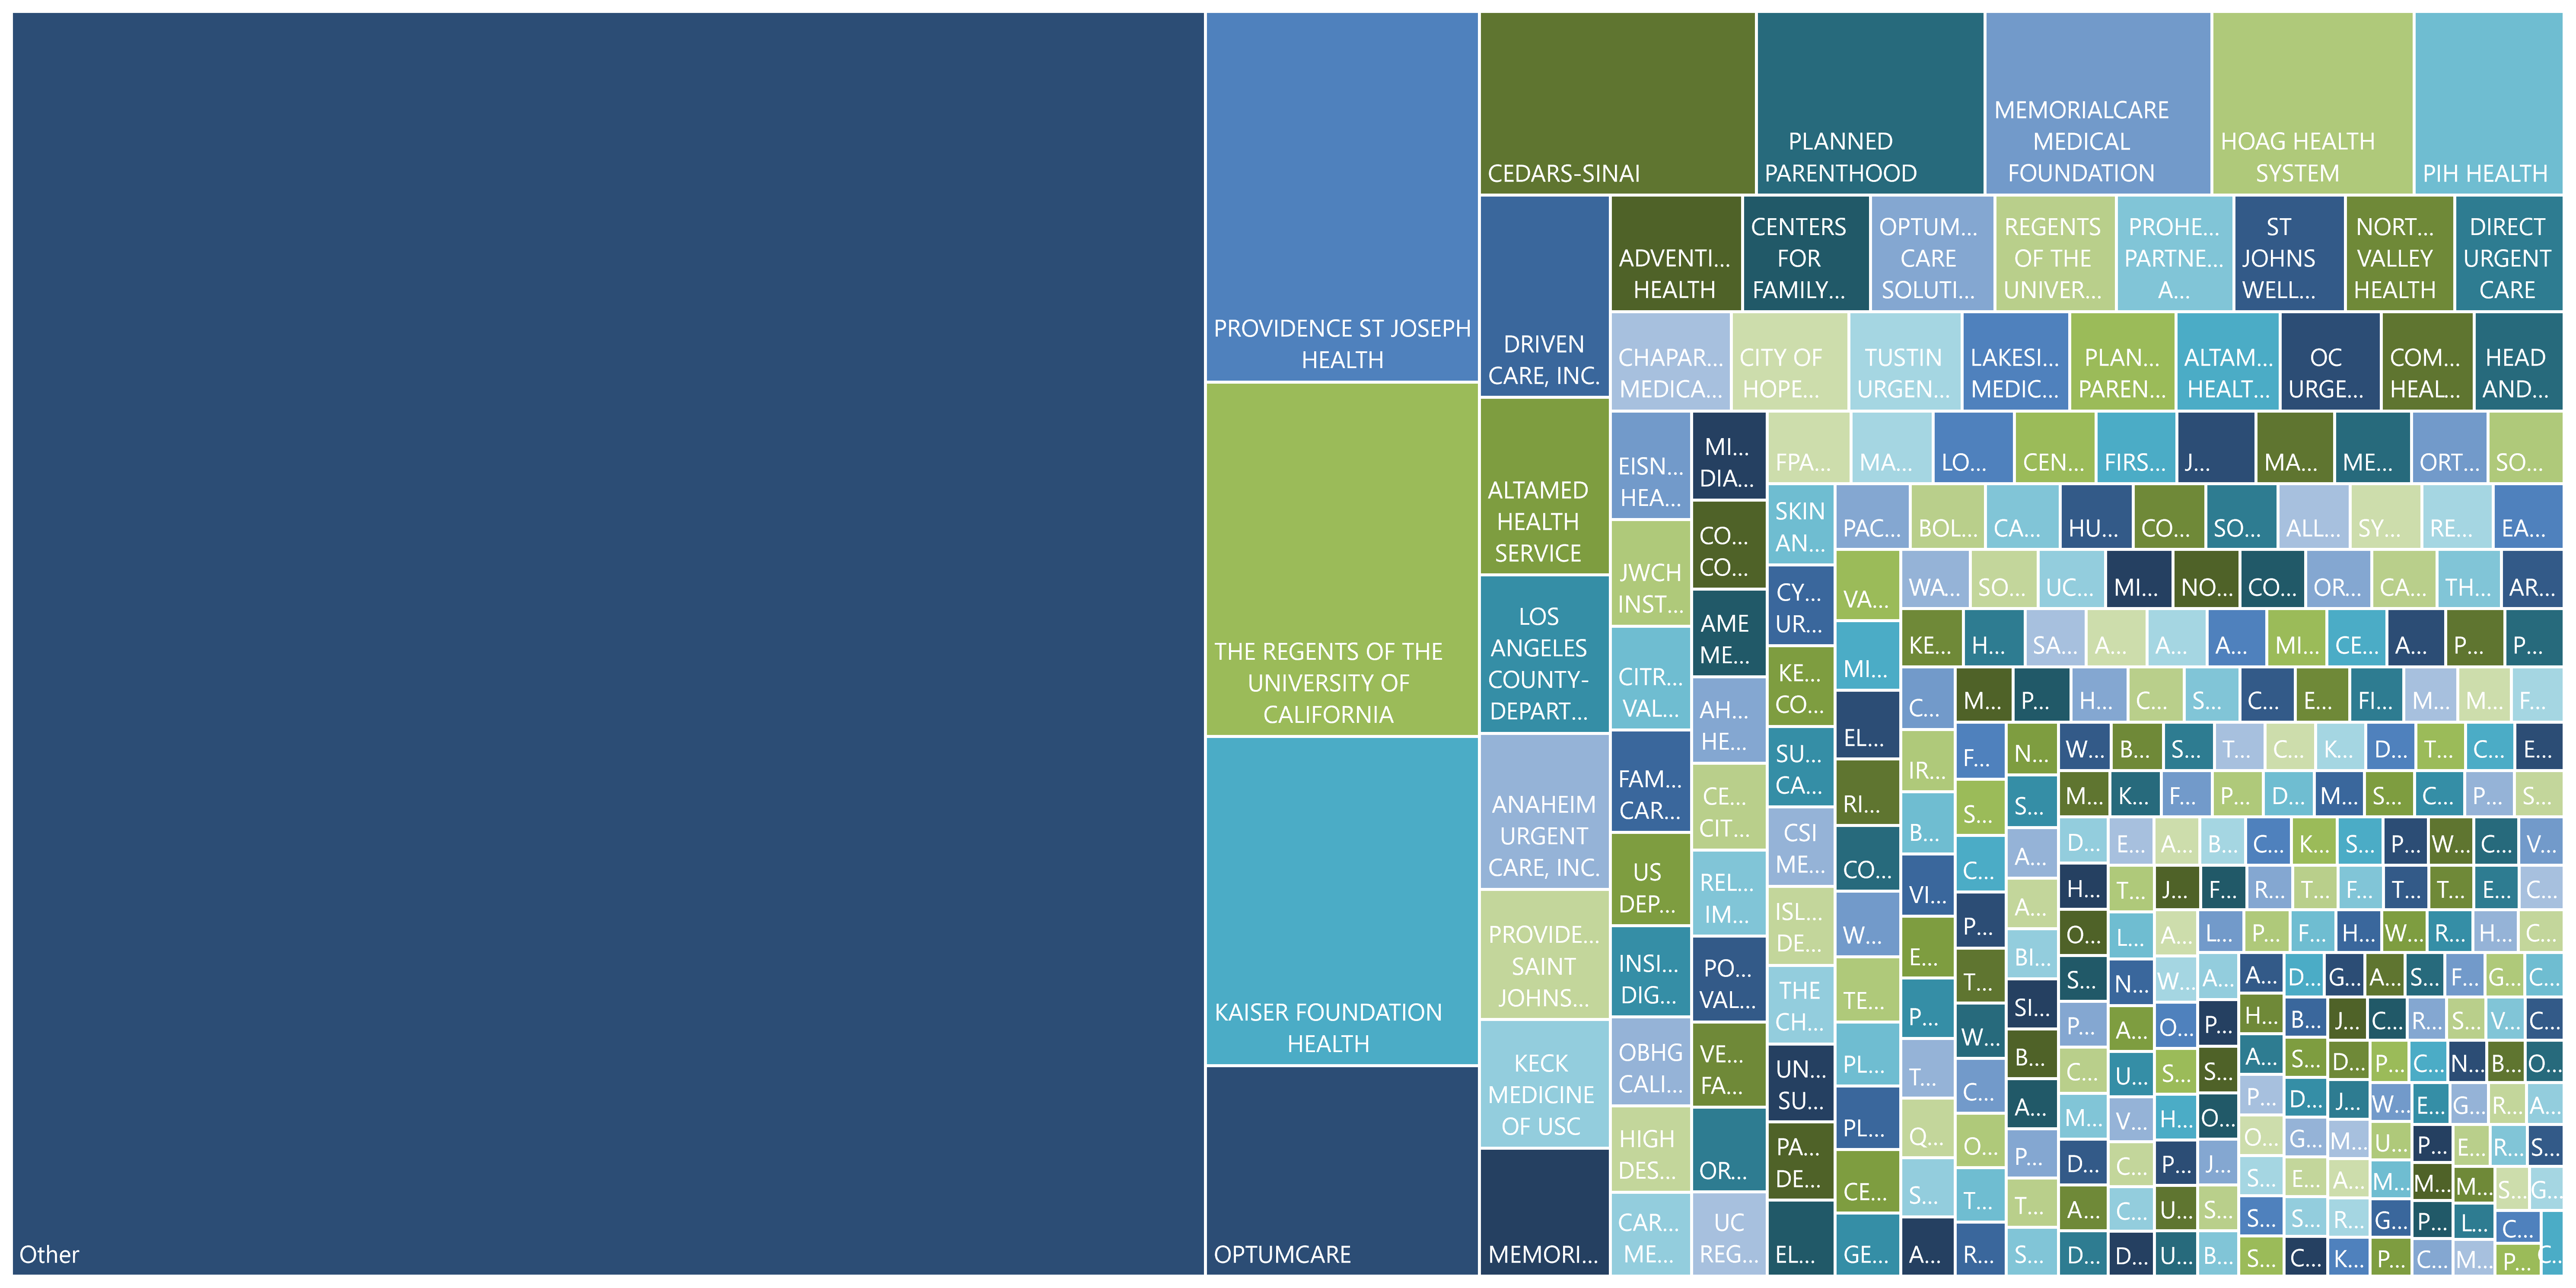
Source: Trilliant Health Provider Directory and national all-payer claims database
The second thing to know about market share is that every market has a total addressable market (TAM) of products and services. Network performance measures how well each health economy stakeholder maximizes its performance against its competitors within the TAM.
In the health economy, the measure of network performance is different for different stakeholders, but the variables that impact network performance are the same for each one: the series, and sequence, of interactions between physicians and patients.
A realistic understanding of market share is almost always sobering but will, for true competitors, catalyze change. A realistic understanding of market share almost always reveals that stakeholders don’t know their customers as well as they think or, more importantly, as they should.
The Questions Every Stakeholder Should Answer
To understand market share, every health economy stakeholder must be able to answer:
- What are the parameters of the market in which the stakeholder offers goods and services? Is the market national, regional, local or hyper-local?
- In how many markets does the stakeholder compete?
- What is the TAM of and general demographic trends in each market in which the stakeholder competes?
- For each target market, is the market expanding or contracting for the product or service offered by the stakeholder?
- Are current market trends evolving due to recently enacted policy, regulatory, reimbursement or technology changes?
- How many competitors offer similar or substitute products or services in each target market?
- What are the general and specific growth trends within each target market? Are competitors entering or leaving a target market?
- What is the stakeholder’s market share percentage and trend by product or service for each target market?
- Does the stakeholder compete more effectively in certain markets? What are the characteristics of the stakeholder’s most profitable markets in comparison to its least profitable markets?
- Having answered these questions, which products or services offer the stakeholder its best opportunity for market share expansion? Which products or services should be deemphasized or abandoned?
Only with a comprehensive understanding of the competitive dynamics in each target market can stakeholders effectively allocate scarce capital resources across their enterprise.
Note that the employer is the only health economy stakeholder who should not focus on the market share or network performance of other health economy stakeholders. Market share, particularly for health systems, is commonly viewed as a proxy for quality, which may or may not be true. Additionally, the Federal government believes that market share is a proxy for higher prices, which is usually not true. Employers, which are ultimately the source of profitable market share for every other health economy stakeholder, should focus on the value for money that stakeholders offer, not their market share.
Use Case: Provider Market Share of Total Addressable Market (TAM)
To calculate market share accurately, health economy stakeholders must first identify all competitors in the applicable total addressable market (TAM) and then quantify the volume of services provided by each competitor.
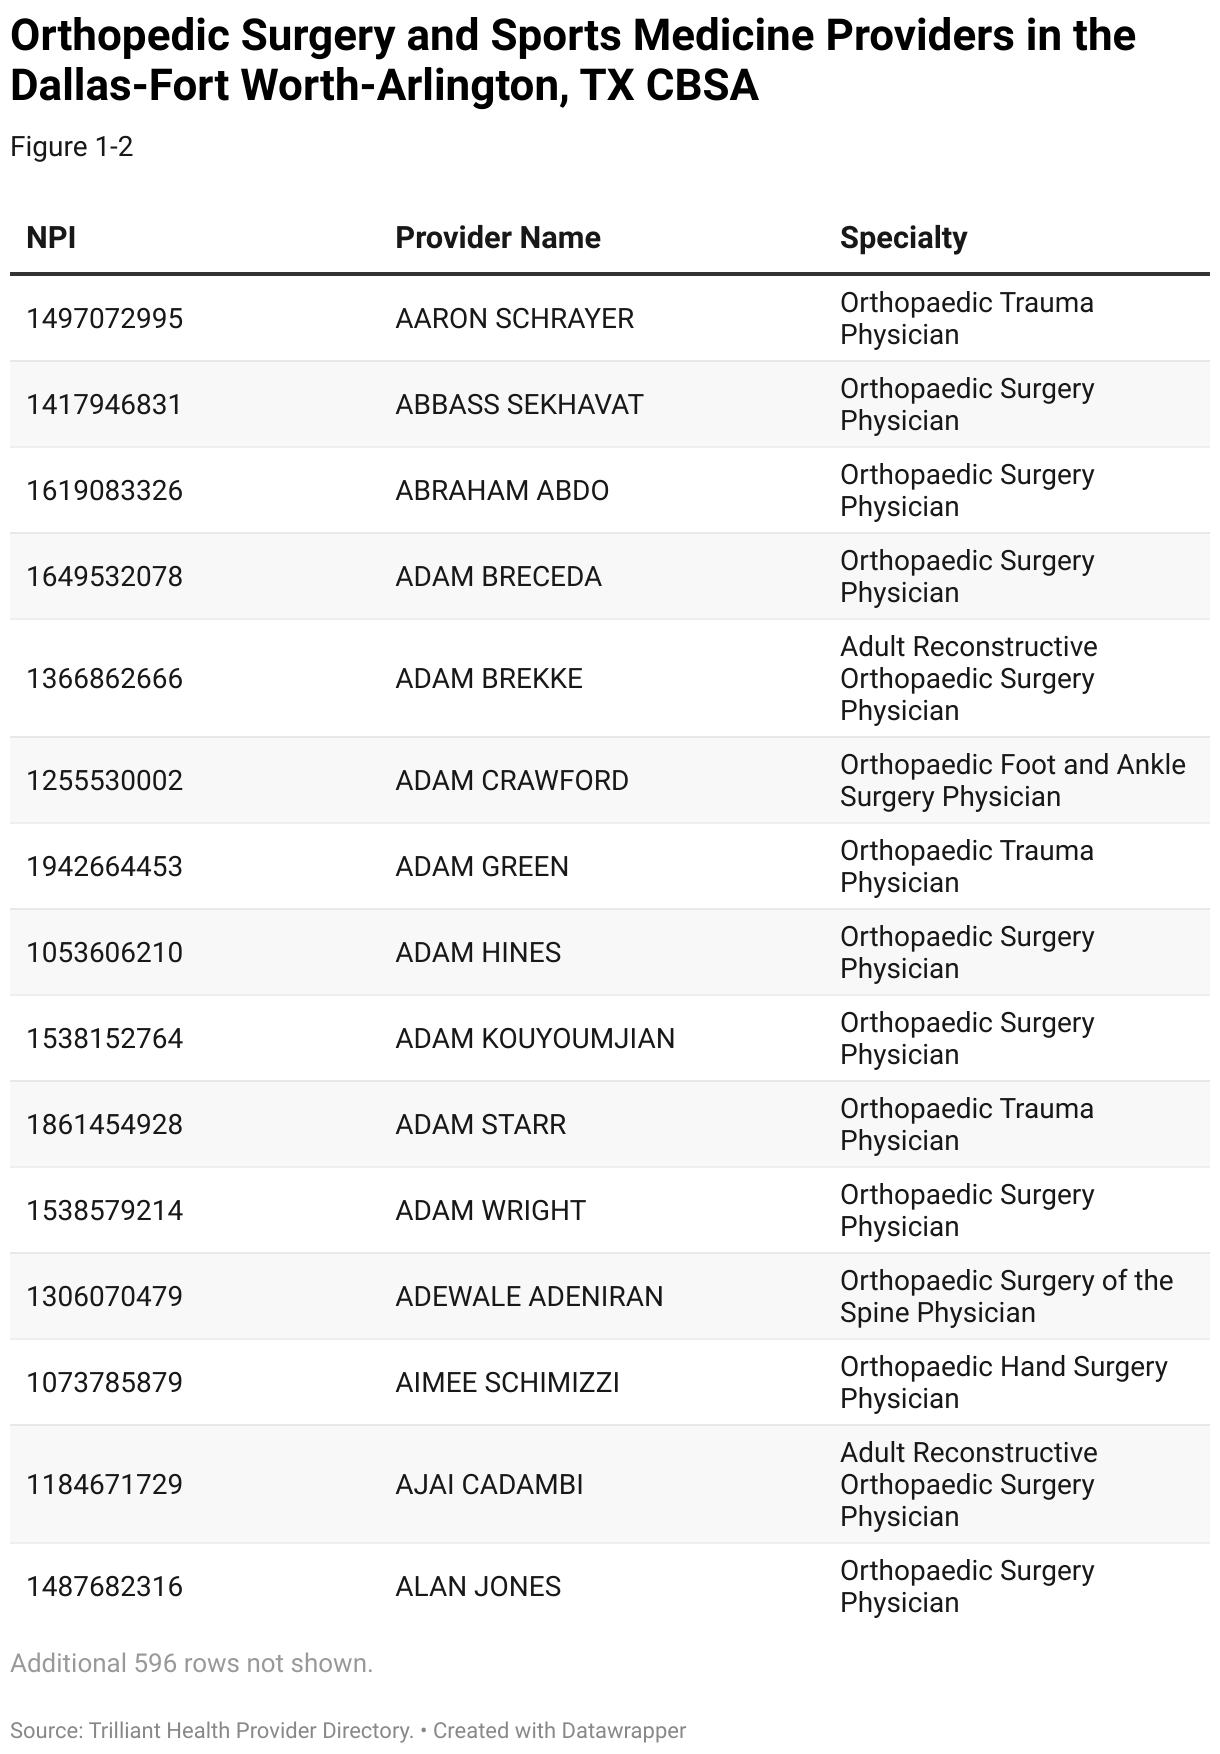
This example uses provider directory data to define the market of physicians rendering orthopedic services in the Dallas-Fort Worth-Arlington, TX, Core-Based Statistical Area (CBSA). The Dallas-Fort Worth-Arlington, TX CBSA has more than 600 orthopedic surgery and sports medicine providers across more than 200 primary practice locations. Calculating the TAM of orthopedic volumes in the Dallas-Fort Worth-Arlington, TX CBSA requires identifying who provides orthopedic services and quantifying the volume and type of services rendered by each such provider. Calculating the market share of facilities delivering orthopedic surgeries requires knowing where the surgeries were performed.
Orthopedic Service Line Access Map for the Dallas-Fort Worth-Arlington, TX CBSA

Source: Trilliant Health Provider Directory
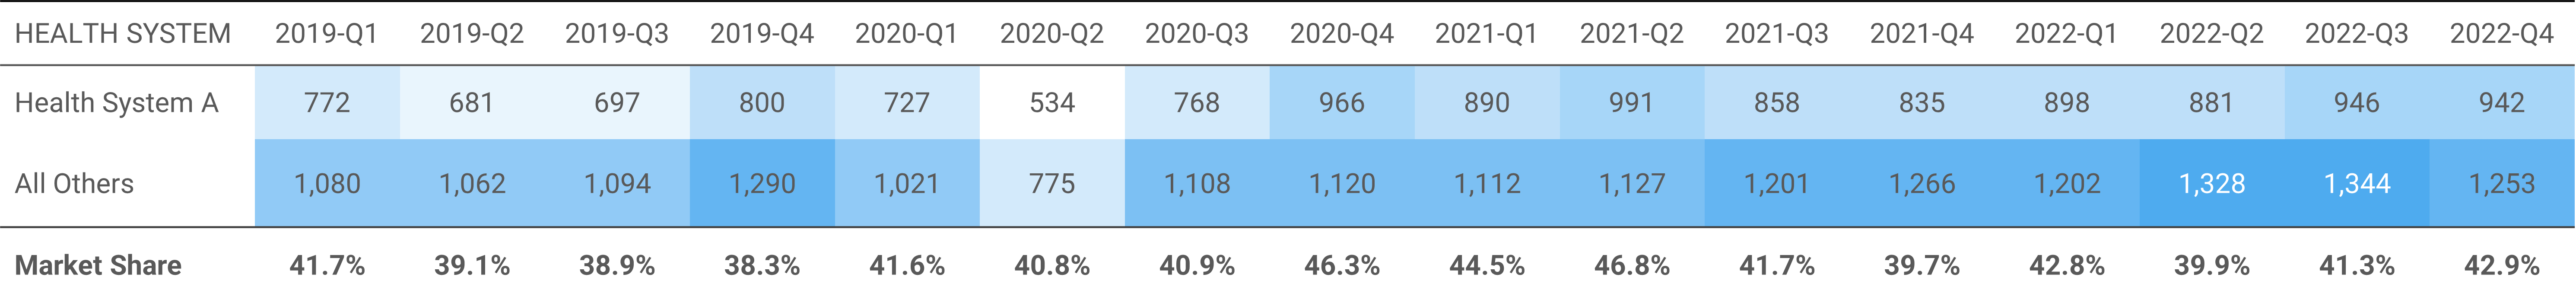
Having identified and compiled utilization data for all competitors in the market, healthcare provider organizations can then begin to understand growth trends, competitive dynamics and market share percentages. In this example, using a combination of provider directory and utilization data, market share for an example health system (“Health System A”) is calculated for the orthopedic service line across all outpatient care settings in a blinded market.
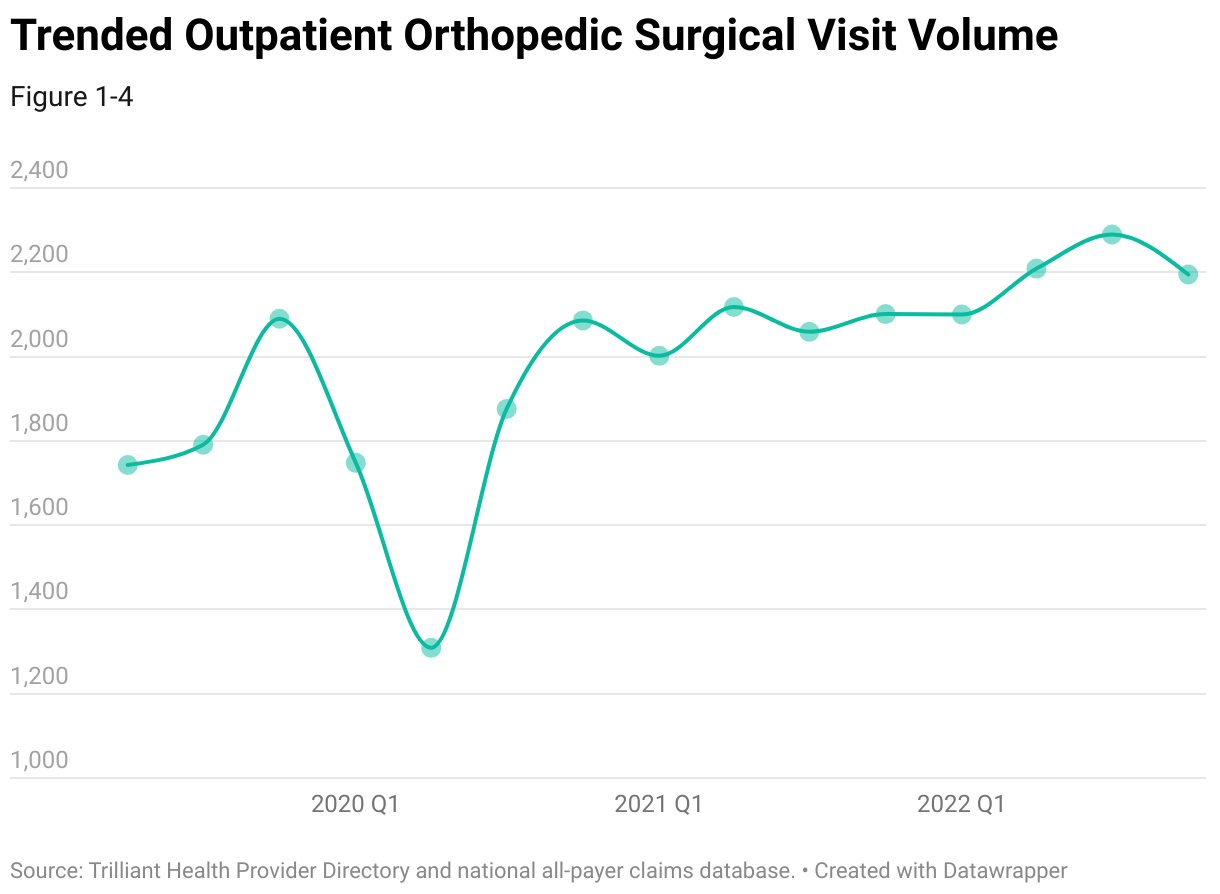
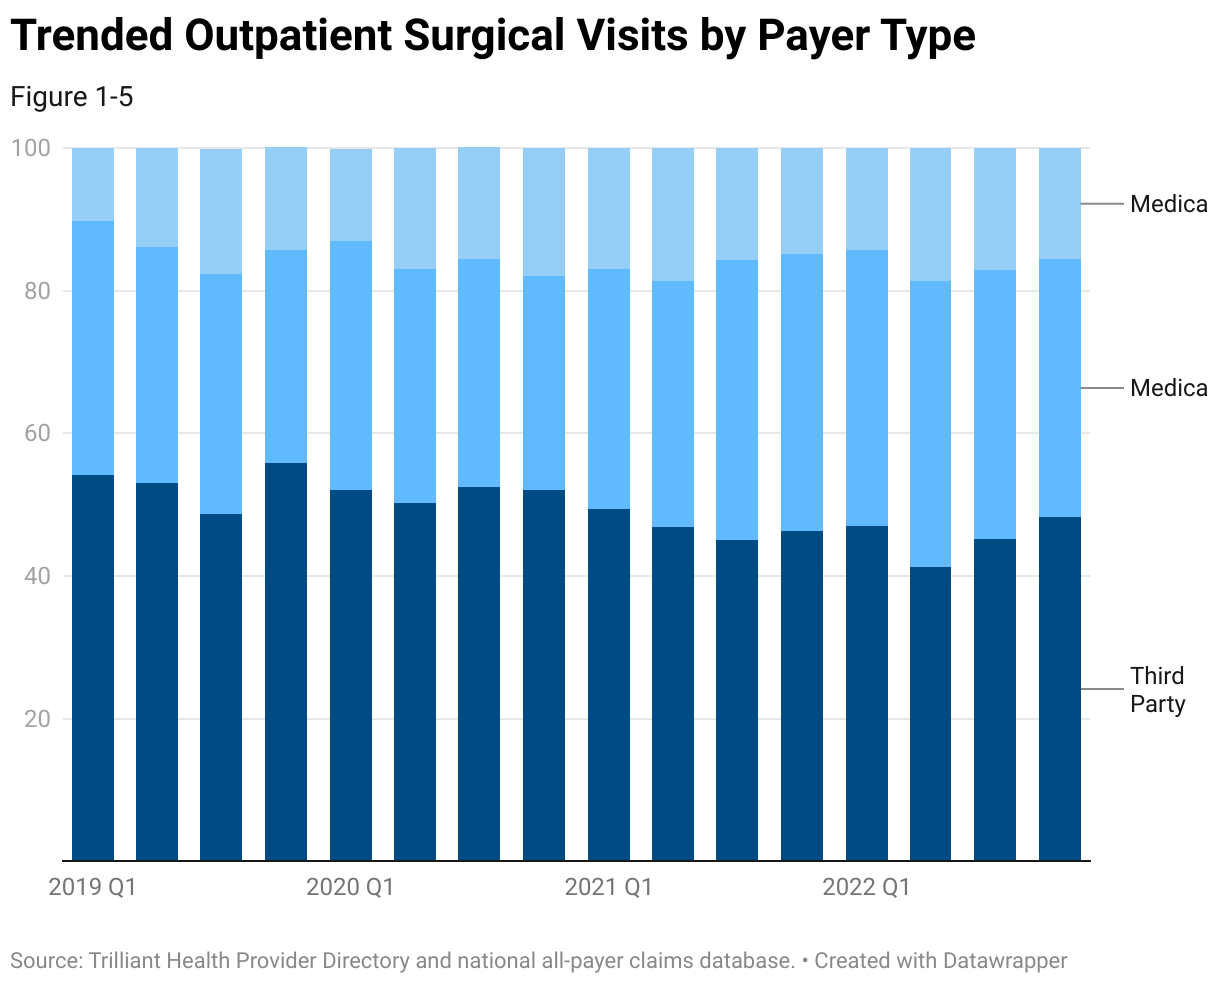
Although the market for orthopedic surgeries has grown slightly quarter-over-quarter, after a significant drop in Q2 2020 due to COVID-19, the share of commercial visits has declined by 5.8 percentage points since Q1 2019, while the share of Medicaid visits has grown by 5.3 percentage points. This market is an example of a negative-sum market for commercially insured patients, requiring stakeholders to compete vigorously to maintain their market share of those patients.
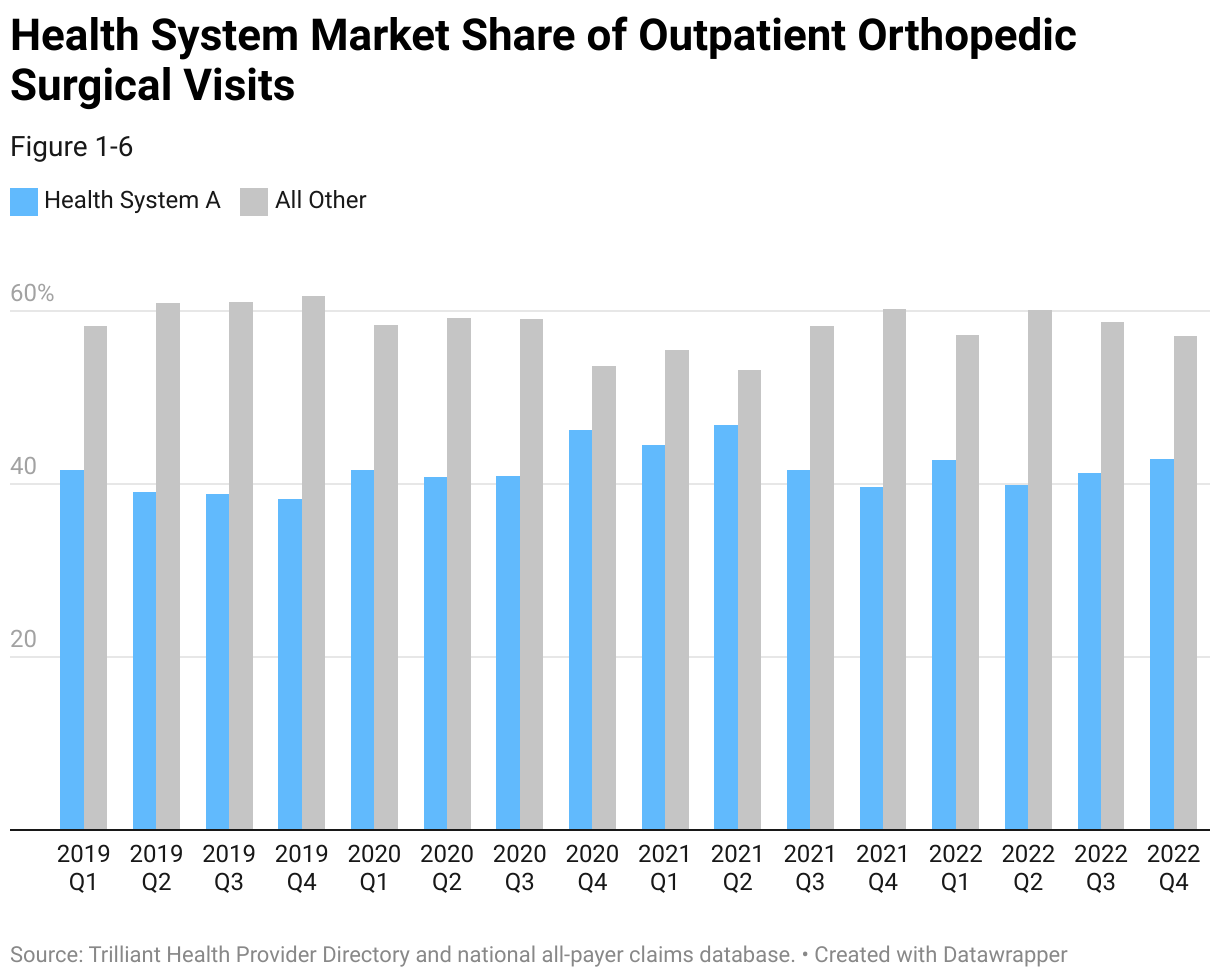
Trended Health System Market Share of Outpatient Orthopedic Surgical Visits
Source: Trilliant Health Provider Directory; national all-payer claims database
Health System A’s market share for outpatient orthopedic surgeries has declined from a peak of 47% in Q1 2021 to 43% in Q4 2022. While Health System A, an academic medical center, has the highest market share in the market, it should develop strategies to defend its market position in an increasingly competitive market, given the significance of outpatient orthopedic surgical visits to the health system’s financial sustainability.
Steps to Calculate a Healthcare Provider’s Market Share
- Internal Planning
Collect internal information to understand the financial contribution of each applicable service line and market position of the provider. Document the impact that each applicable service line has on the provider, how that service line compares to others and how the service line might be improved.
- Define the Market
Identify the geographic areas and demographic segments that define the primary and secondary service area for the applicable service lines, focusing on utilization-based service areas that reflect patient migration for the relevant services, whether inpatient, outpatient or both.
- Curate Market Data
Configure external data sources around the defined service area. Normalize the data to align with internal service line definitions and classifications, which may involve mapping external categories or codes to internal service line categories. Determine key metrics for standard market share reporting, such as patient volume, procedures performed, revenue generated or market size for applicable service lines. Group providers by system affiliation and isolate target care settings for detailed reporting around inpatient and outpatient market share.
- Calculate Market Share
Use the curated external data to calculate market share for each applicable service line. Market share can be calculated by dividing operating metrics (e.g., patient volumes, procedures, revenue, etc.) by the total market size for the applicable service line within the defined geography.
- Visualize and Report
Present market share data in easy-to-understand visualizations such as charts, graphs or dashboards. Ensure that the reporting format is user-friendly and accessible to stakeholders involved in the strategic decision-making process. Apply easy-to-use filters so that key stakeholders can segment the data by procedure type, care setting and payer.
- Identify Trends and Patterns
Analyze trends and patterns in market share over time and across different demographic segments or service lines. Assess competitor market share, strengths, weaknesses and strategies to understand your competitive position. Based on the analysis, identify growth opportunities within the market and potential threats to system share.
- Develop Strategies
Develop strategic initiatives to capitalize on opportunities, address weaknesses and improve market share. Continuously monitor market dynamics, competitor performance and the effectiveness of strategic initiatives, and adjust strategies as needed to maintain or improve market share. By following these steps and leveraging comprehensive data sources, providers can gain valuable insights into market share and make informed decisions to drive growth and performance.
Use Case: Health Plan Market Share by Geography
Payers can readily calculate total market share at the state level, but not within the individual markets within a state. Market share can and frequently does vary significantly in sub-markets within the defined market. By understanding market share within sub-markets, payers can use demographic data and utilization patterns to inform network adequacy at the neighborhood level. By understanding utilization patterns within sub-markets, payers can identify opportunities to reduce medical loss ratio (MLR) by directing care to lower-cost settings.
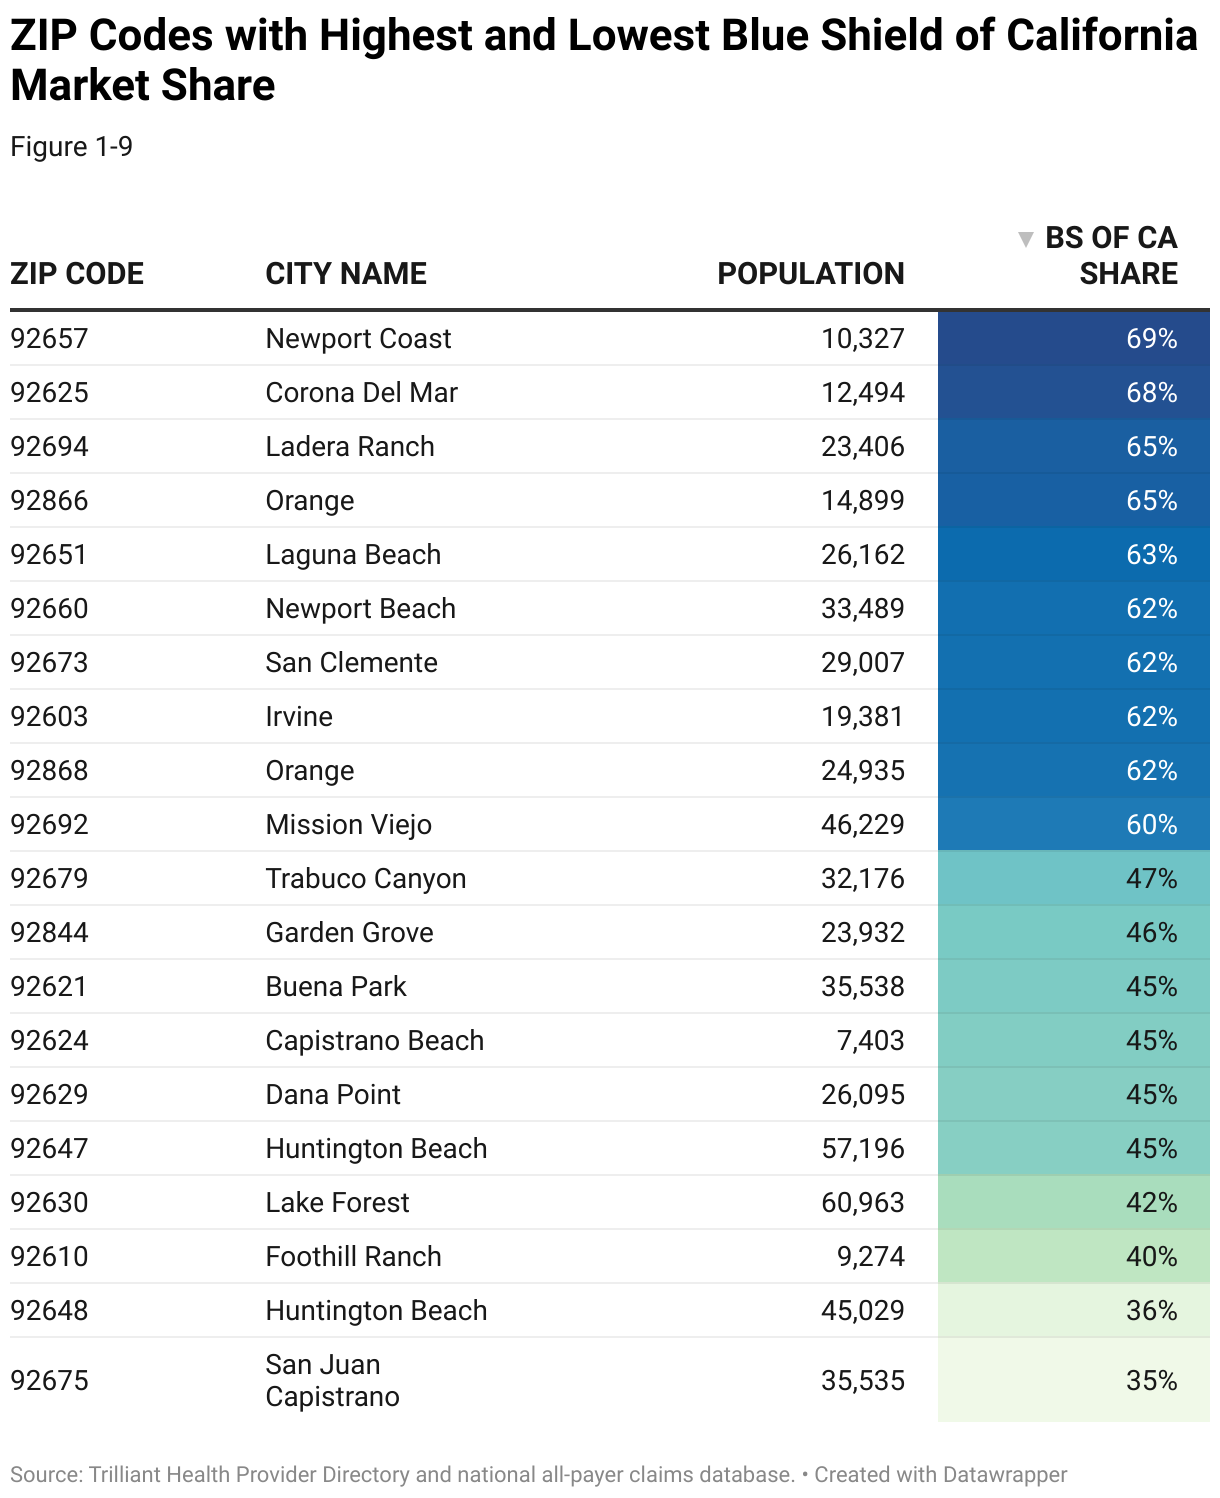
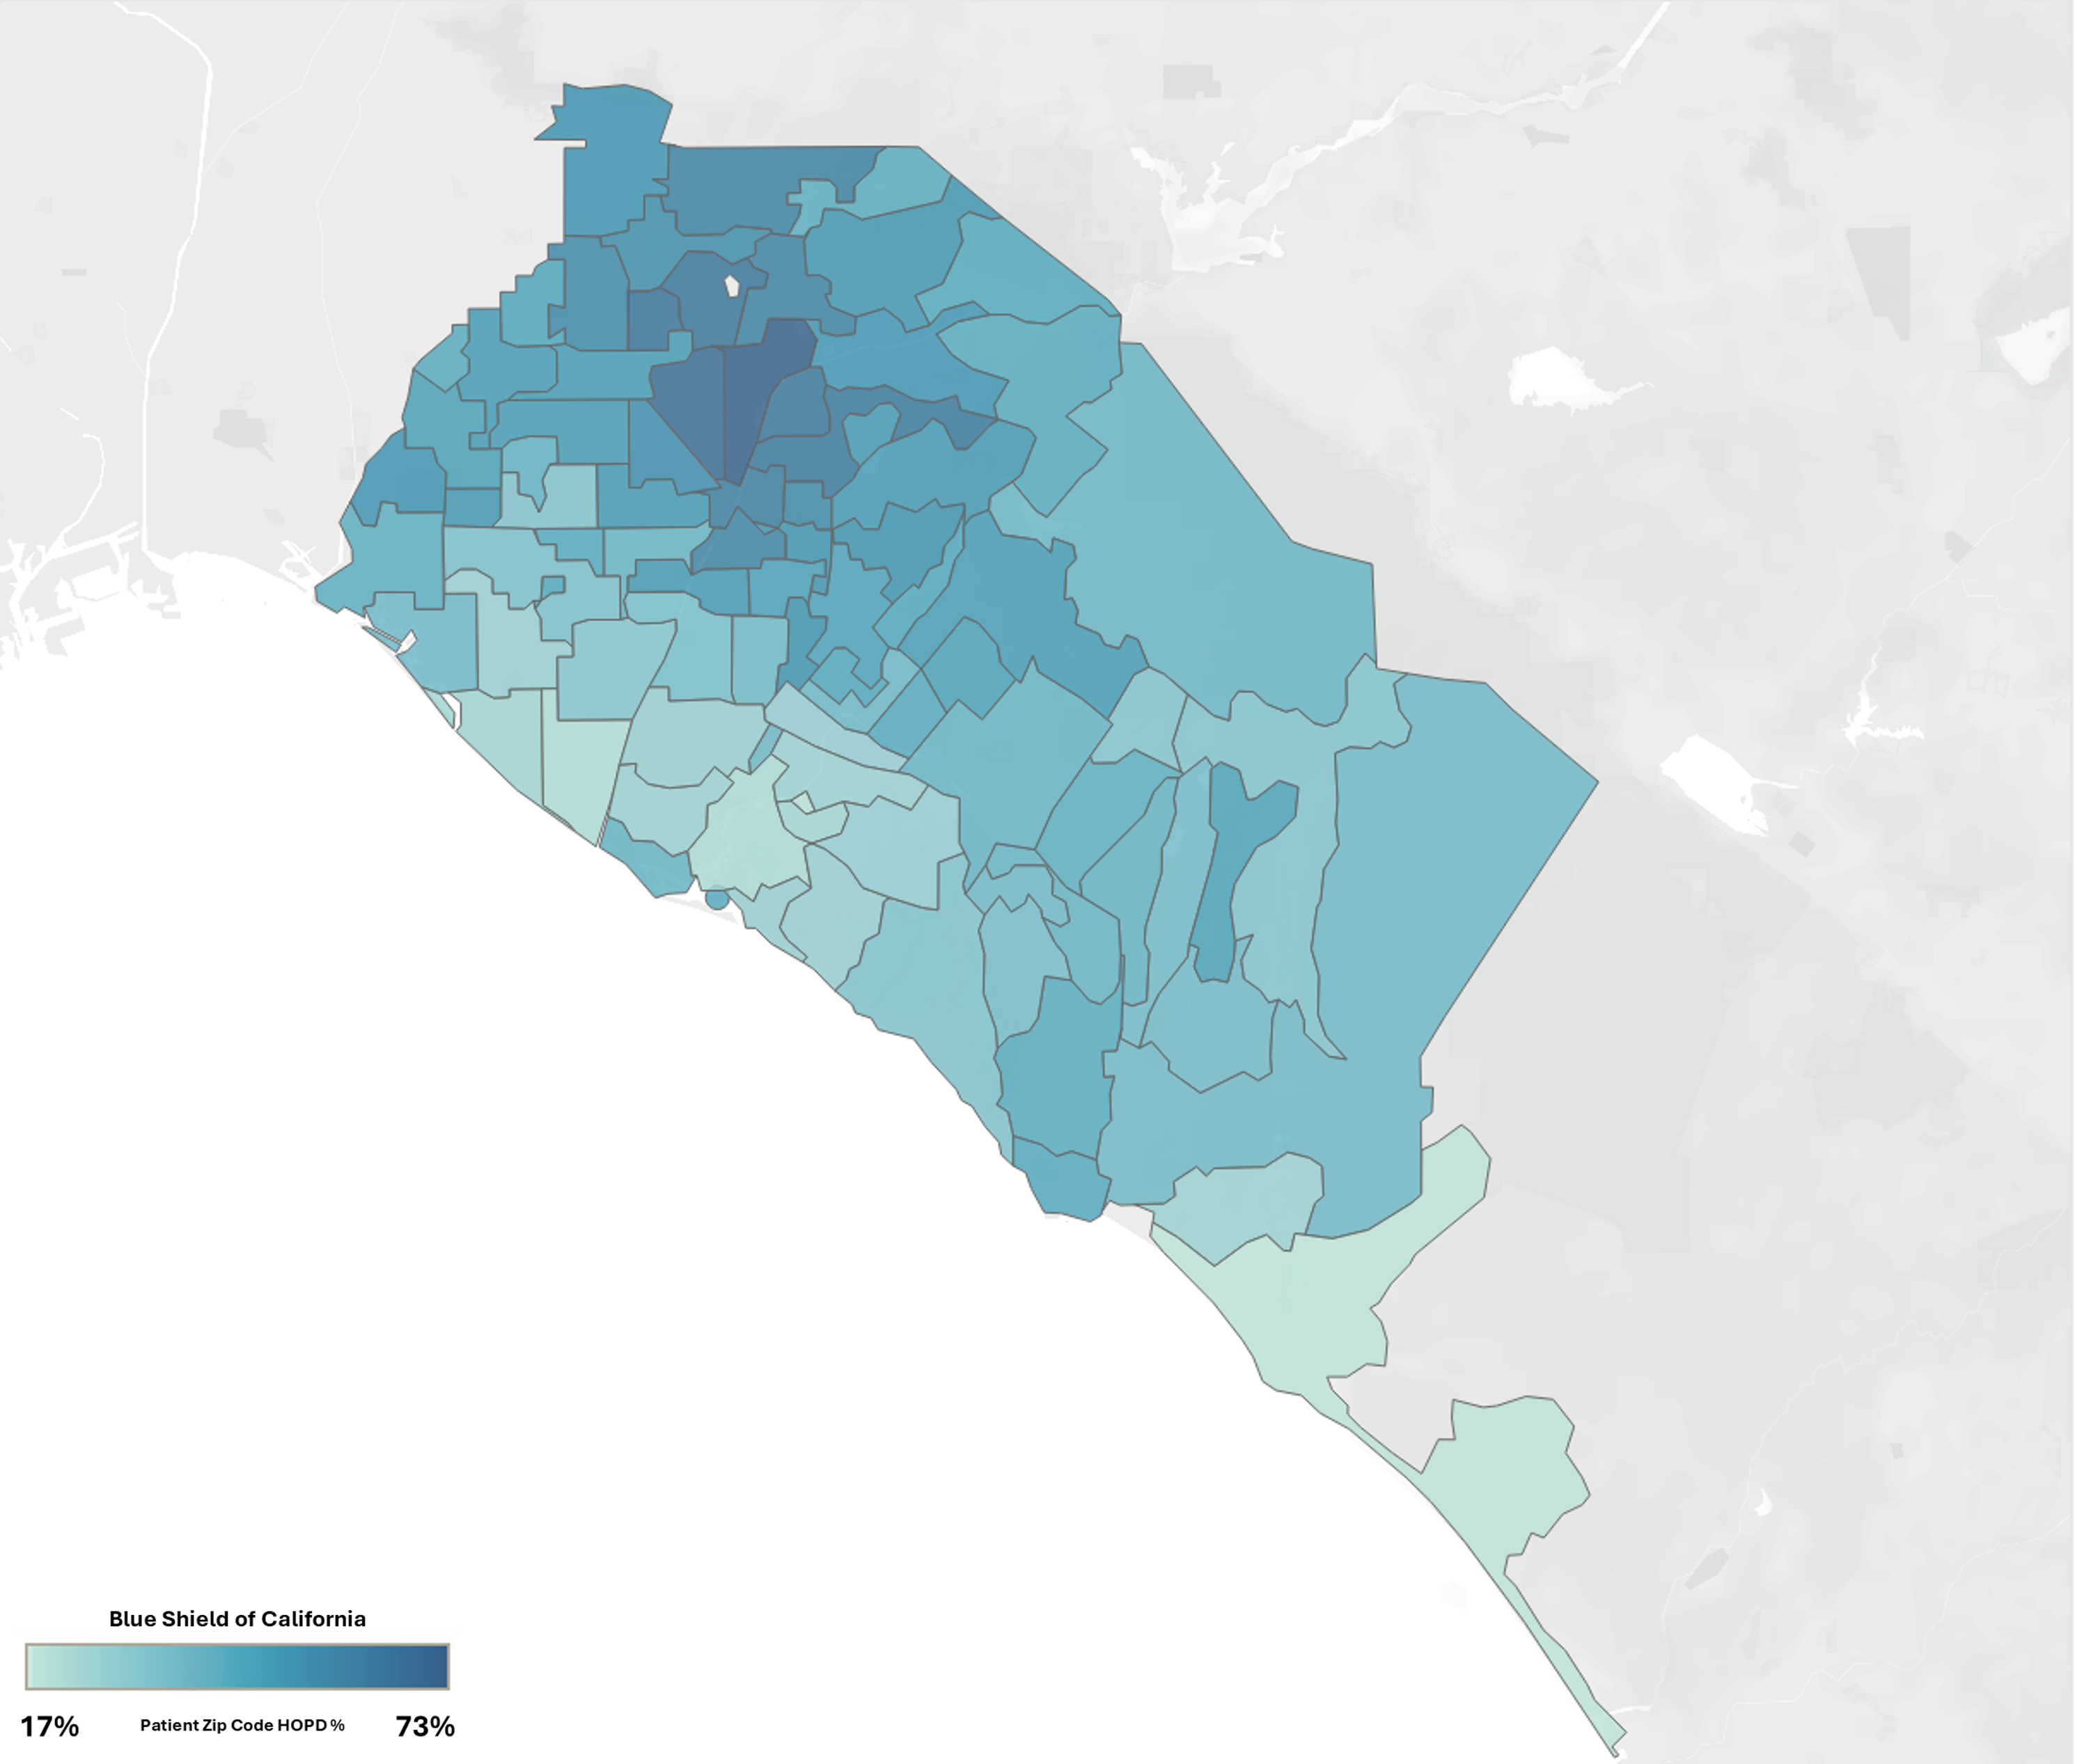
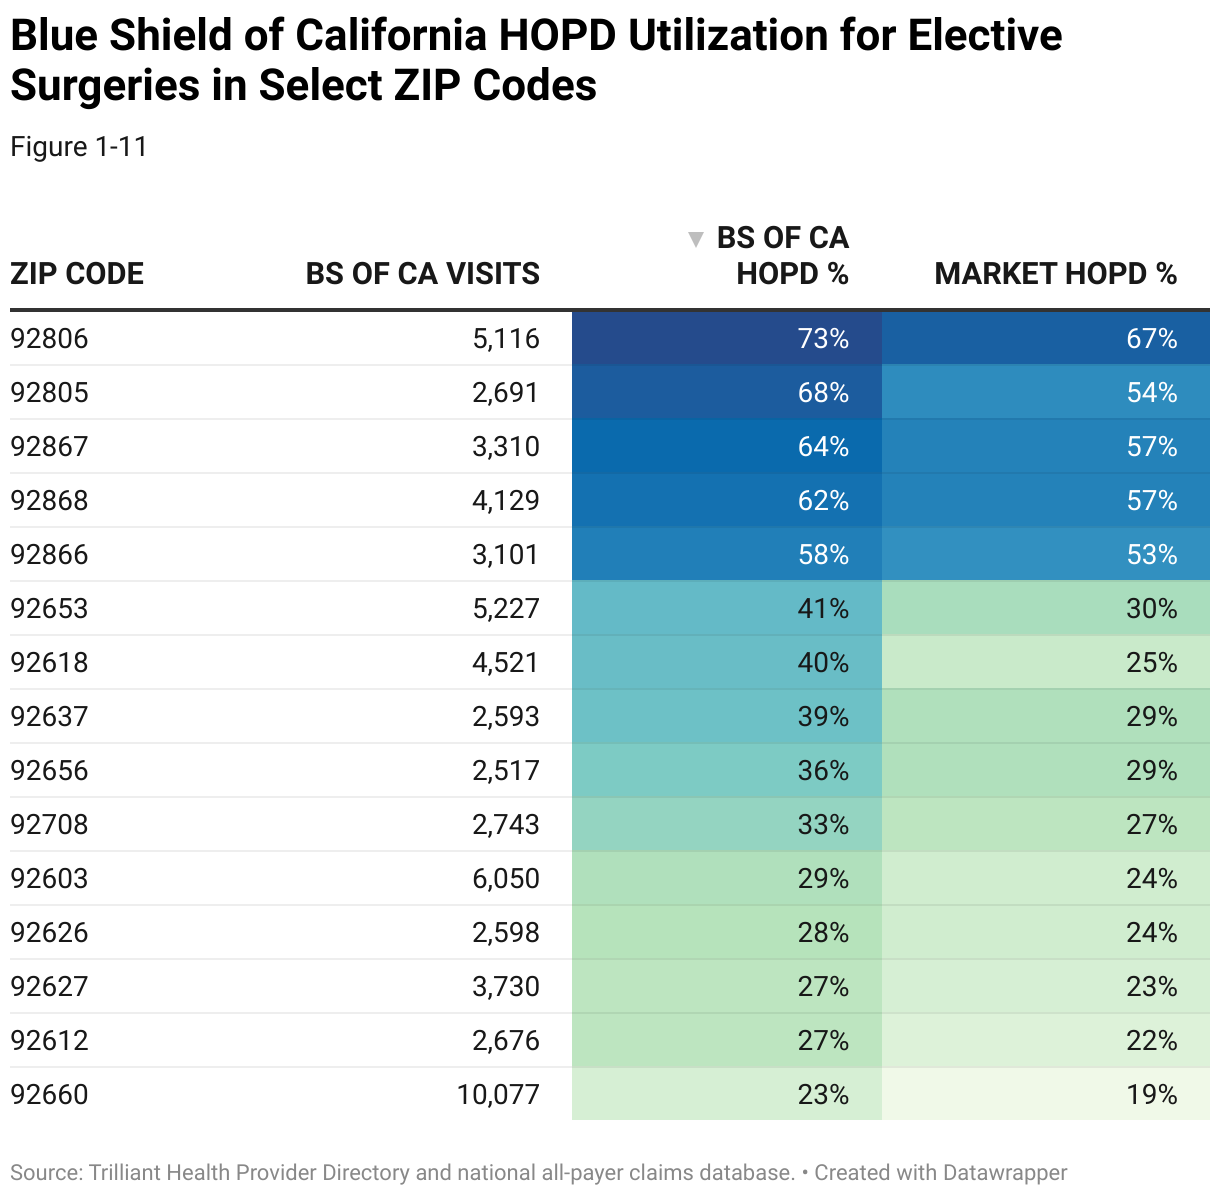
In this example, using utilization and consumer data, market share for Blue Shield of California is calculated as the number of distinct patients at the ZIP Code level based upon Trilliant Health’s proprietary “patient personal service area” designation. While Blue Shield of California is the dominant health plan in the market, its market share varies across ZIP Codes in the Los Angeles Combined Statistical Area (CSA). Moreover, this example demonstrates that Blue Shield members utilize hospital outpatient departments for ambulatory surgery at a higher percentage than the market average in every ZIP code.
Blue Shield of California Market Share by Patient ZIP Code
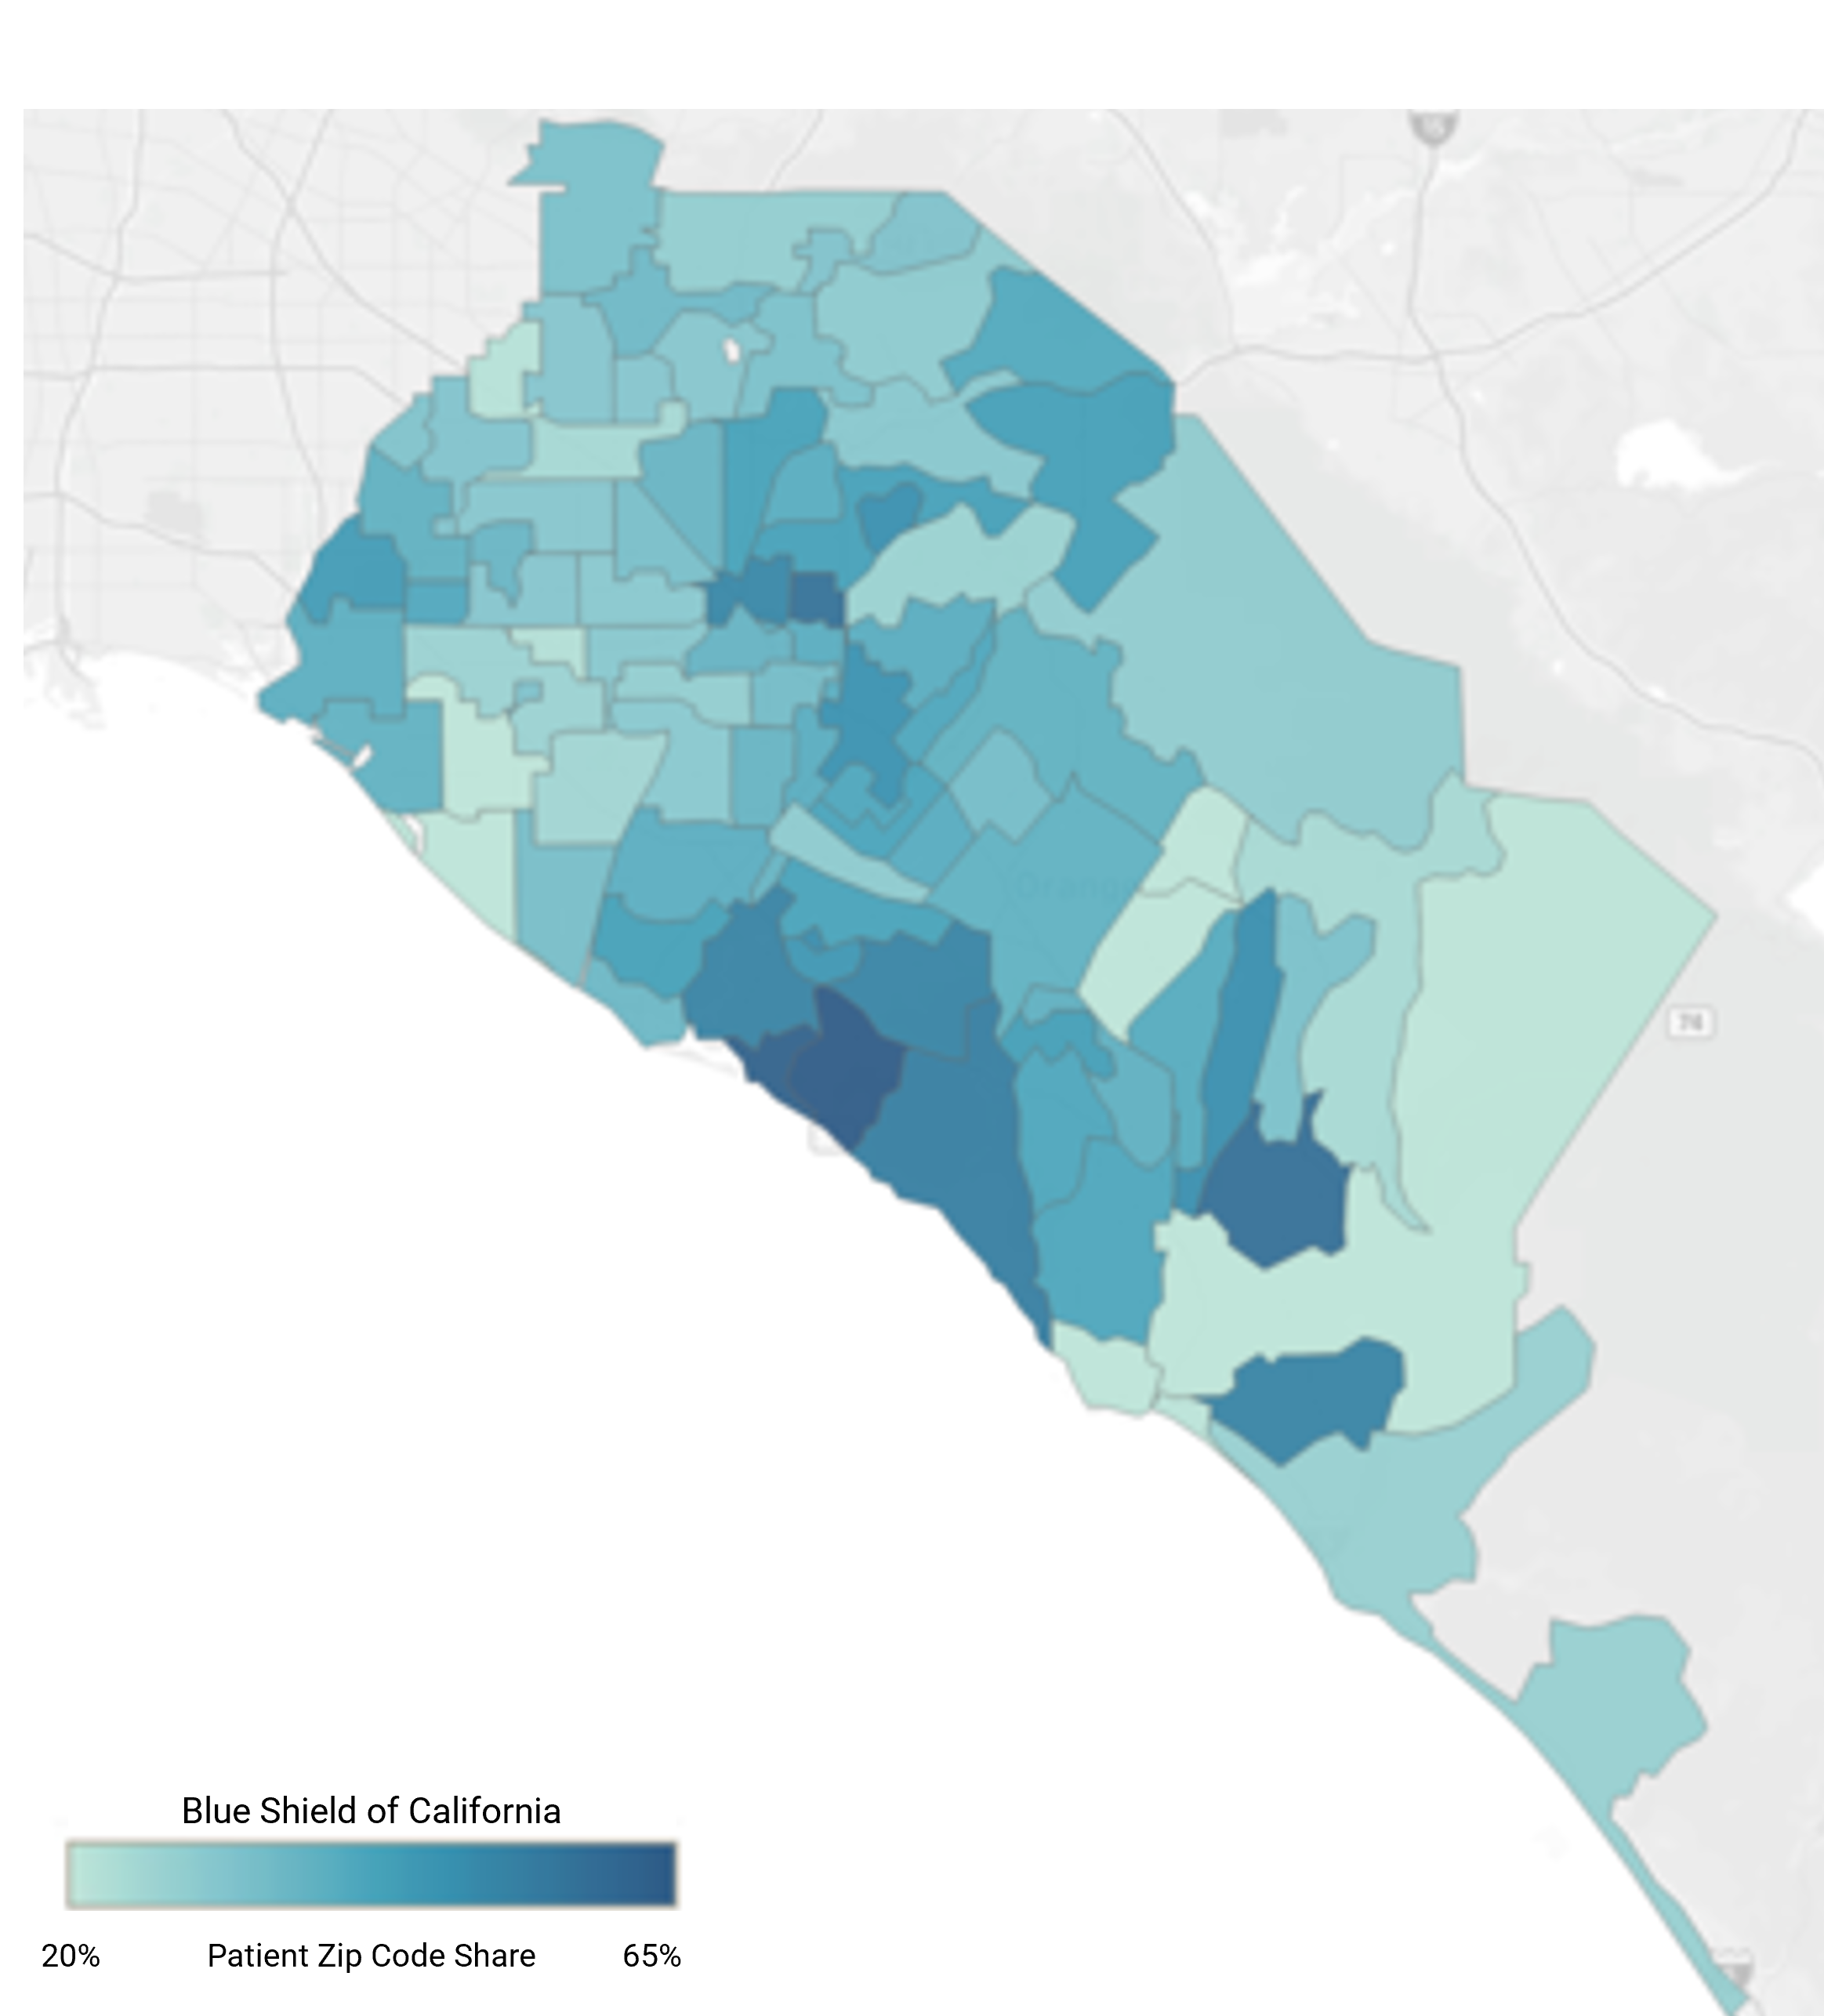
Source: Trilliant Health national all-payer claims database
Blue Shield of California Utilization of Hospital Outpatient Department (HOPD) for Elective Surgeries
Source: Trilliant Health Provider Directory and national all-payer claims database
Steps to Calculate a Health Plan’s Market Share
- Internal Planning
Collect internal information from each department to understand the contribution that each line of business makes to the health plan’s financial sustainability and market position.
- Define the Market
Identify the geographic areas and demographic segments that define the health plan’s service area.
- Curate Market Data
Configure external data sources around the defined service area. Determine key metrics for standard market share reporting, such as member population, utilization and medical loss ratio. Group individual providers based on affiliation/ownership and isolate target care settings for detailed reporting around inpatient and outpatient market share.
- Calculate Market Share
Use the curated external data to calculate market share for each key line of business or service line. Market share can be calculated by dividing health plan performance metrics (e.g., member enrollment, member utilization by procedure type, member utilization by site of service, etc.) by the total market size for the line of business within the defined geography.
- Visualize and Report
Present market share data in easy-to-understand visualizations such as charts, graphs, or dashboards. Ensure that the reporting format is user-friendly and accessible to stakeholders involved in the strategic decision-making process. Apply easy-to-use filters so that key stakeholders can segment the data by procedure type, care setting and payer.
- Identify Trends and Patterns
Analyze trends and patterns in market share over time and across different demographic segments, lines of business or service lines. Assess competitor market share, strengths, weaknesses and strategies to understand your competitive position. Based on the analysis, identify membership growth opportunities and unit level cost opportunities at line of business level.
- Develop Strategies
Develop strategic initiatives to capitalize on opportunities, address weaknesses and improve market share. Continuously monitor market dynamics, competitor performance and the effectiveness of strategic initiatives, and adjust strategies as needed to maintain or improve market share. By following these steps and leveraging comprehensive data sources, health plans can gain valuable insights into market share, utilization and cost trends and make informed decisions to increase membership, understand utilization trends and improve medical loss ratio.
Use Case: Life Sciences Market Share Based on Surgeon Alignment
For medical device companies, understanding market share within a target market is crucial for informing sales, marketing, product development and product launch strategies.
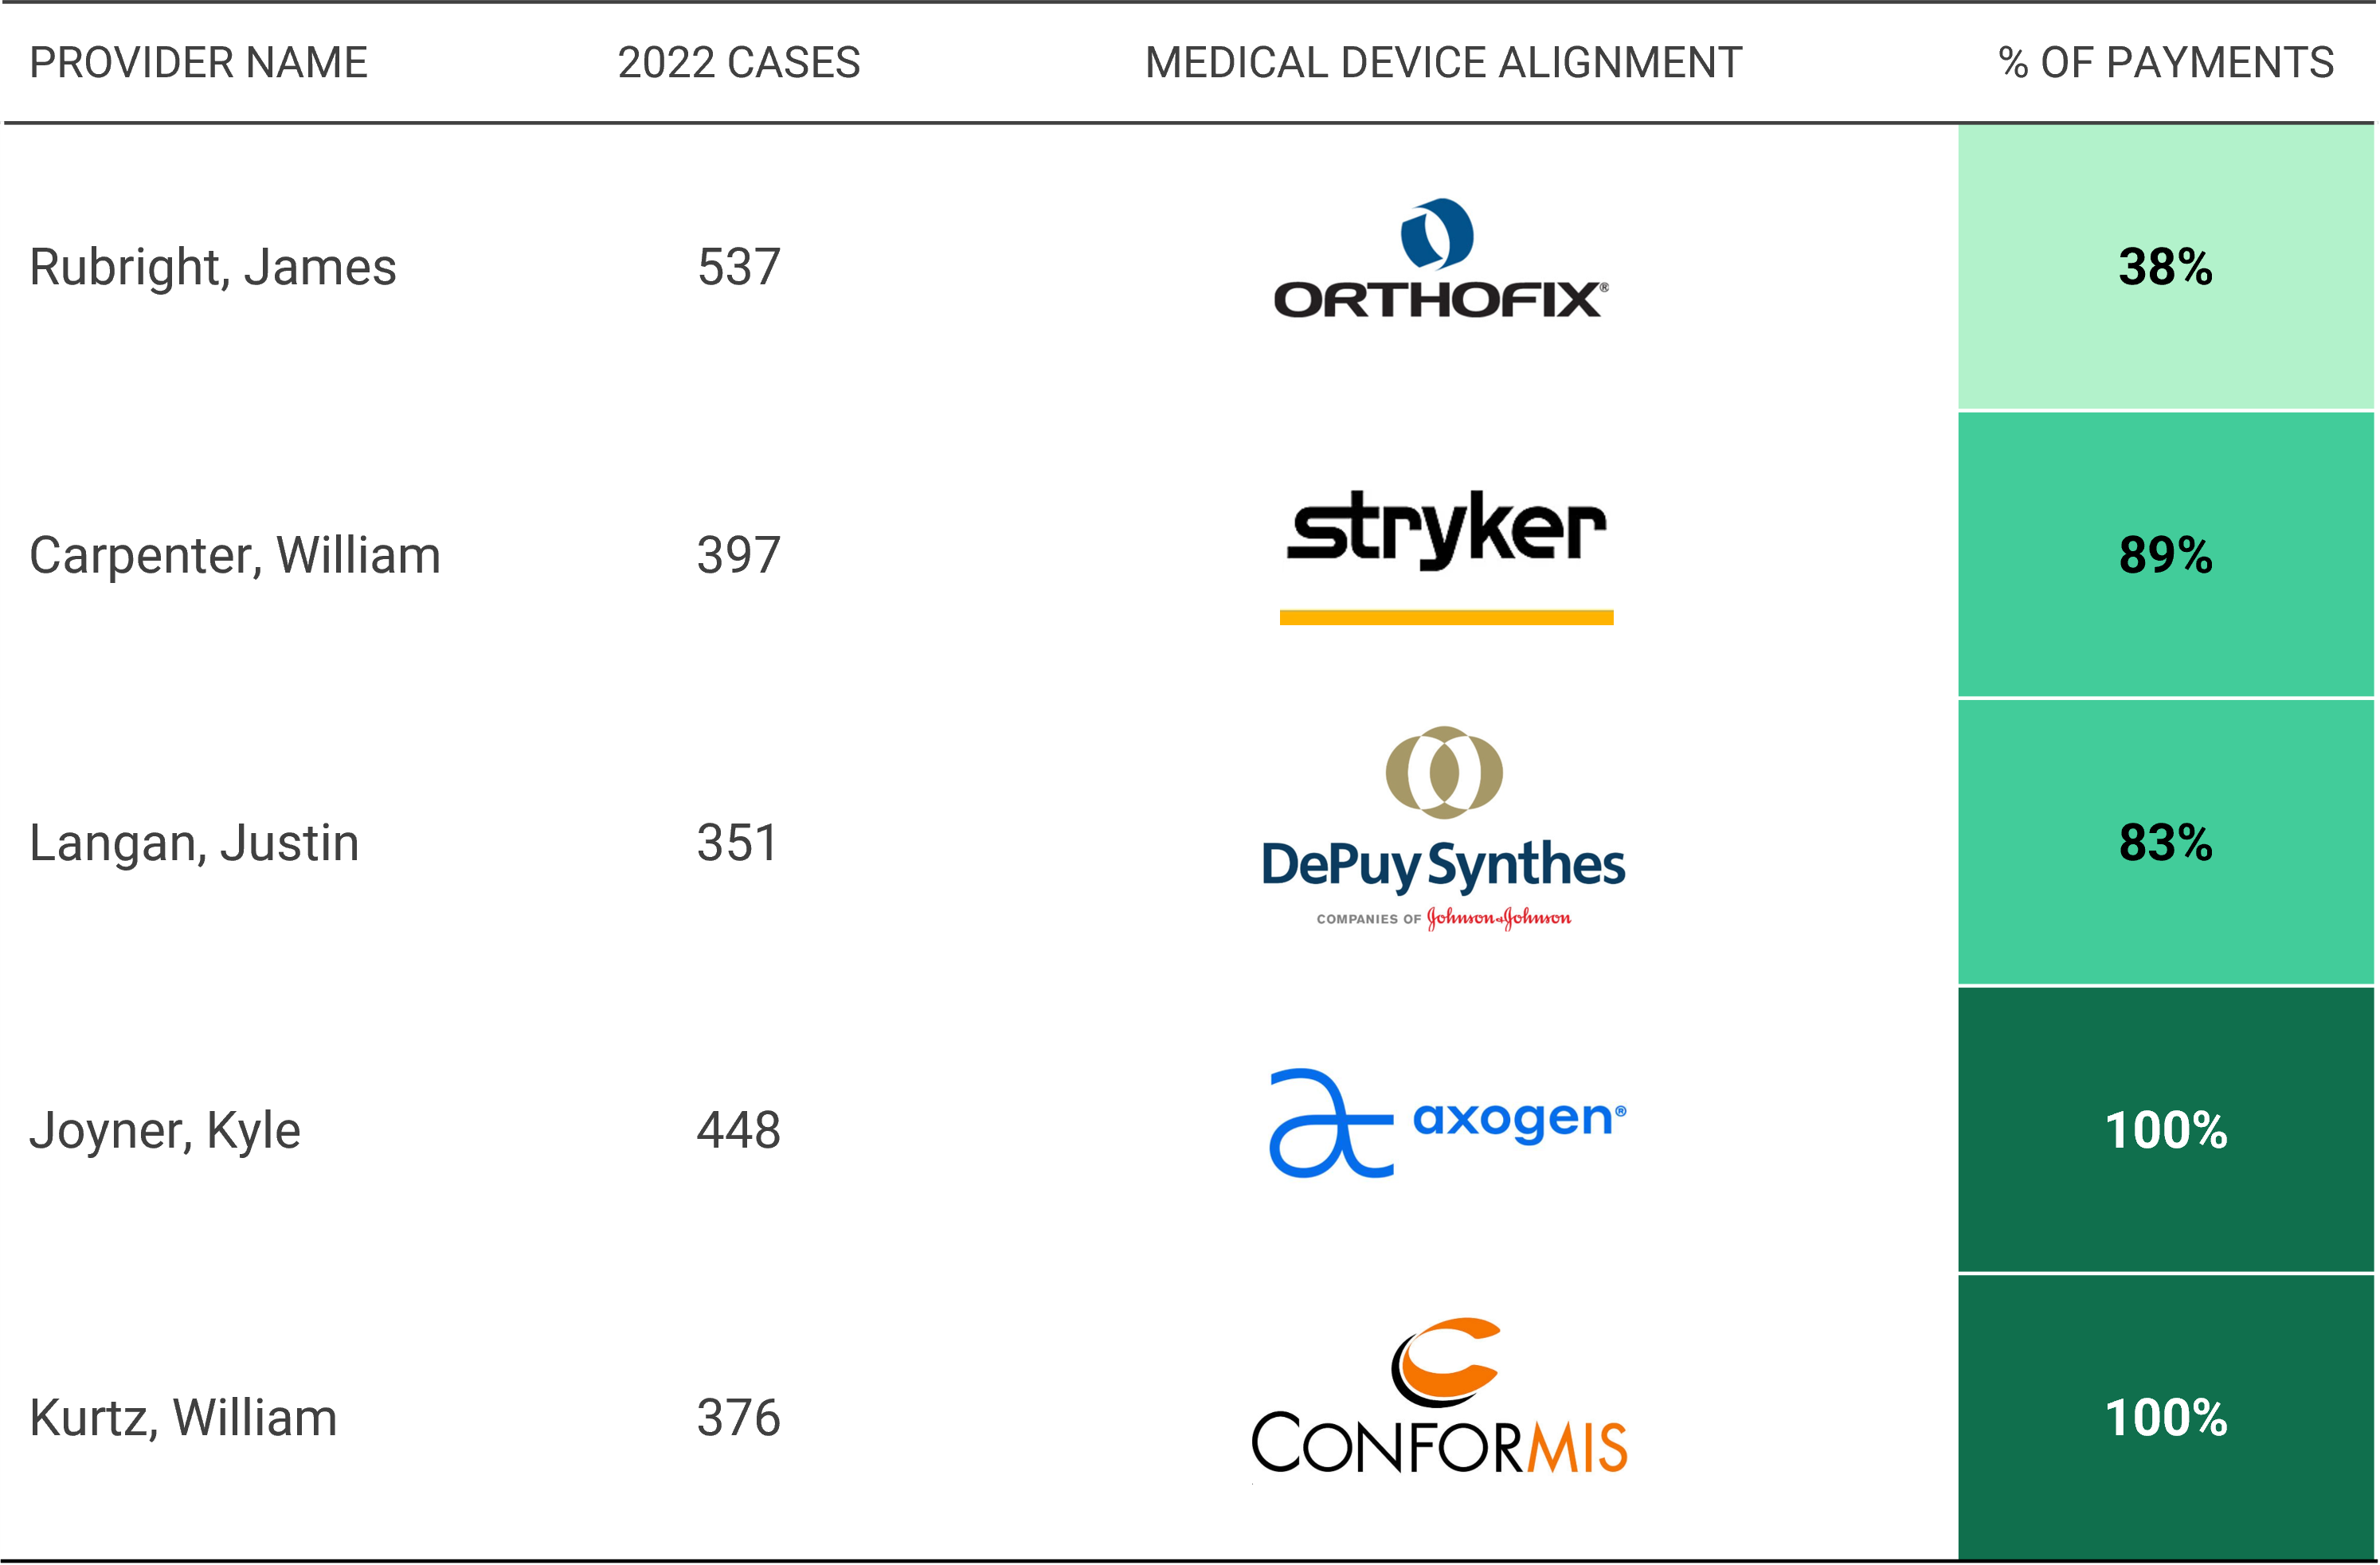
In this example, using a combination of provider directory, utilization and Open Payments data, the financial relationships between medical device companies and an example orthopedic practice in Nashville, TN are used to estimate each firm’s market share. This orthopedic group specializes in adult reconstructive surgeries and receives payments from numerous life sciences firms, including Conformis (33.4% of total payments to the medical group), Stryker (31.3%) and DePuy Synthes (27.8%). However, for hand surgeries, this group is primarily aligned with Axogen (60.9% of total payments for hand surgeons).
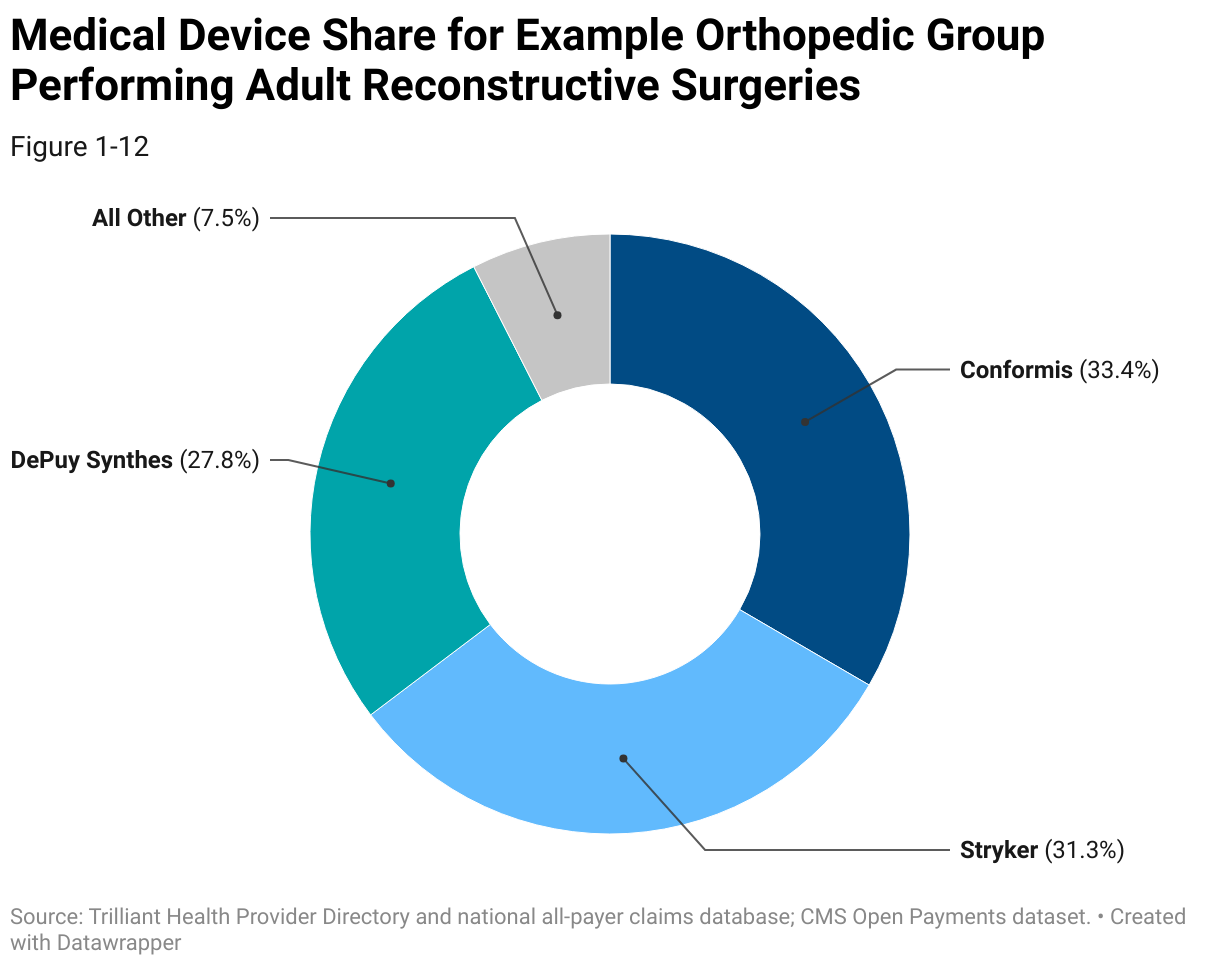
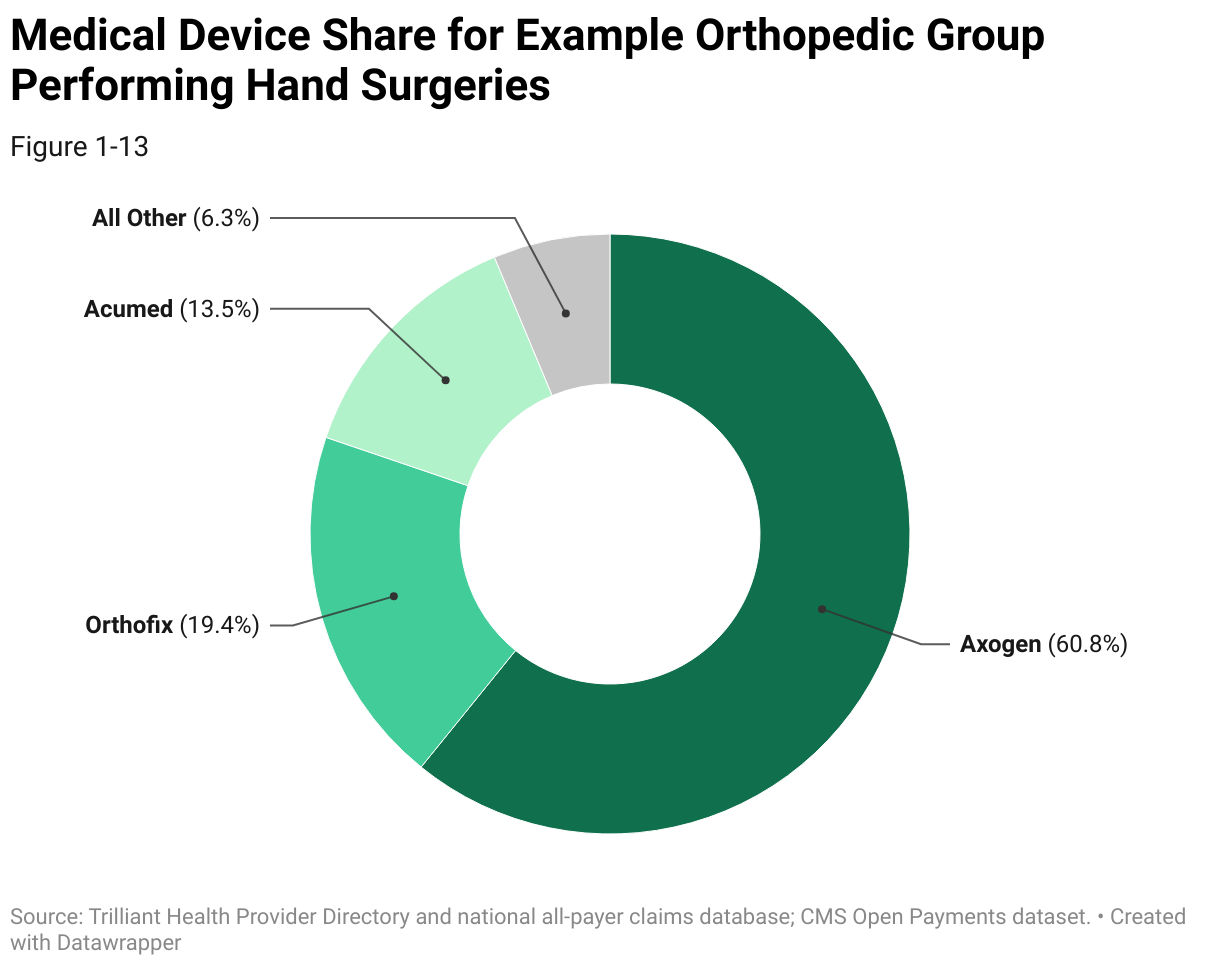
Within the practice, surgeons have different levels of alignment to medical device firms. Some surgeons are highly aligned, with all reported payments coming from a single firm. Other surgeons have a lower degree of alignment, with payments from multiple medical device companies. By linking surgeon alignment to utilization, medical device companies can estimate their market share.
Medical Device Share by Surgeon in Example Orthopedic Group Performing Adult Reconstructive Surgeries
Trilliant Health Provider Directory and national all-payer claims database; CMS Open Payments dataset
Steps to Estimate a Life Sciences Firm’s Market Share
- Define the Market
Clearly define the geographic area and target service line segment. The geography could be a region, state, CBSA, healthcare facility or provider group. The target service line segment could encompass specific procedures such as joint replacement, sports medicine, spine surgery, etc.
- Targeting and Segmentation
Identify key decision-makers and influencers within the target market who order or utilize medical devices. Leverage external market data to identify high-value provider groups based on specialty, practice affiliation and payer mix. Research each provider to learn more about their background and medical training. Examine the service mix, competitive position and facility affiliation of each provider group.
- Analyze Procedure Data
Configure external data sources around the defined service line segment using target procedure codes. Isolate target procedures to understand current demand within the defined geography and prioritize accounts strategically based on procedure volume at the individual provider level. Refine facility affiliation metrics based on where each provider performs target procedures.
- Assess the Competitive Landscape
Assess the presence and activity of competitors within the defined market segment, identifying which providers are aligned with which medical device companies. Develop strategies and tactics to establish new provider relationships and/or opportunities to expand the current product mix. Analyze factors that may influence change in share, such as new product launches, pricing strategies or changes in provider preferences.
- Develop Go-to-Market Strategy
Analyze trends and patterns in market share over time. Empower sales representatives to identify trends and optimize outreach efforts around high-value prospects, including refining product offerings, adjusting pricing strategies, enhancing provider support or expanding market reach. Continuously monitor changes in market dynamics, competitor activities and provider preferences. Adjust strategies accordingly to maintain or improve market position within the target market over time.