Pricing Strategies for Employers
The health plan price transparency component of CMS’s Transparency in Coverage initiative reveals an existing market rate for both inpatient and ambulatory healthcare services. However, as detailed in the Introduction, negotiated rates for the same plan for the same service in the same market are widely divergent, but there is no observed correlation between price and quality in healthcare services at the national level. As a result, ensuring that employees make informed choices about value is the only way for employers to receive value for money for their health care expenditures and, in turn, the only way to “bend the cost curve” in the health economy.
How can employers receive value for money from their health benefits expense?
First, every employer should ask their health insurance broker these questions:
- What is the amount of the commission paid to the broker by the carrier?
- Why is there such a wide range of quality outcomes, especially mortality, among in-network providers?
- Why is there such a wide range of rates among in-network providers offering equivalent quality for identical services?
- Why do some in-network providers receive above-average rates for below-average quality?
- Why do some in-network providers receive below-average rates for above-average quality?
Second, every employer should analyze in-network providers based on value – the intersection of quality and rate. In almost every case, the analysis will reveal that employers could bend the cost curve significantly merely by steering “away” from a handful of providers who are outliers on price or quality for a particular service line, in turn revealing the fallacy of “narrow networks” and steerage “to” a limited set of providers.
Third, every employer must understand that generating value for money requires value-based competition by providers across every service line, meaning that open networks and any willing provider statutes are essential. As a result, employers should design benefits at the service-line level in every market that allow employees the freedom to choose any provider they want while tiering benefits to incentivize higher-value care and disincentivize lower-value care.
Use Case: Competing on Price and Convenience for Low-Acuity Care
Health economy stakeholders can deliver value for money to the customer – the employer – in one of three ways:
- Better than average quality at a price at or near the median market rate
- Average quality at a price that is below the median market rate
- Better than average quality at a price that is below the median market rate
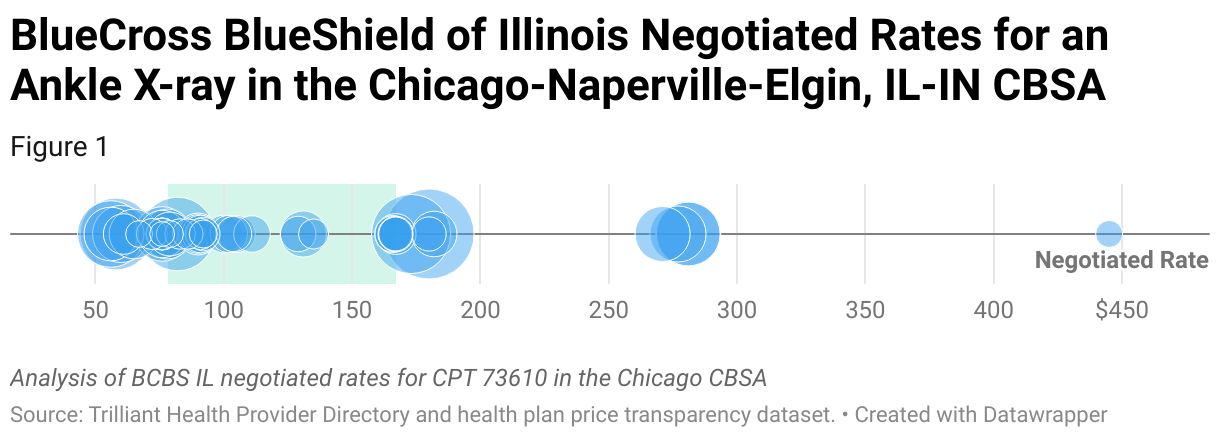
The lower the acuity of care, the more that value depends on price and convenience.
In this example, using a combination of provider directory, utilization and health plan price transparency data, there is a 1,100% variance in rate in the Chicago-Naperville-Elgin, IL-IN CBSA for ankle X-rays:
Use Case: Directing Employees Away from Lower-Value Care Settings to Higher-Value Care Settings
Health economy stakeholders can deliver value for money to the customer – the employer – in one of three ways:
- Better than average quality at a price at or near the median market rate
- Average quality at a price that is below the median market rate
- Better than average quality at a price that is below the median market rate
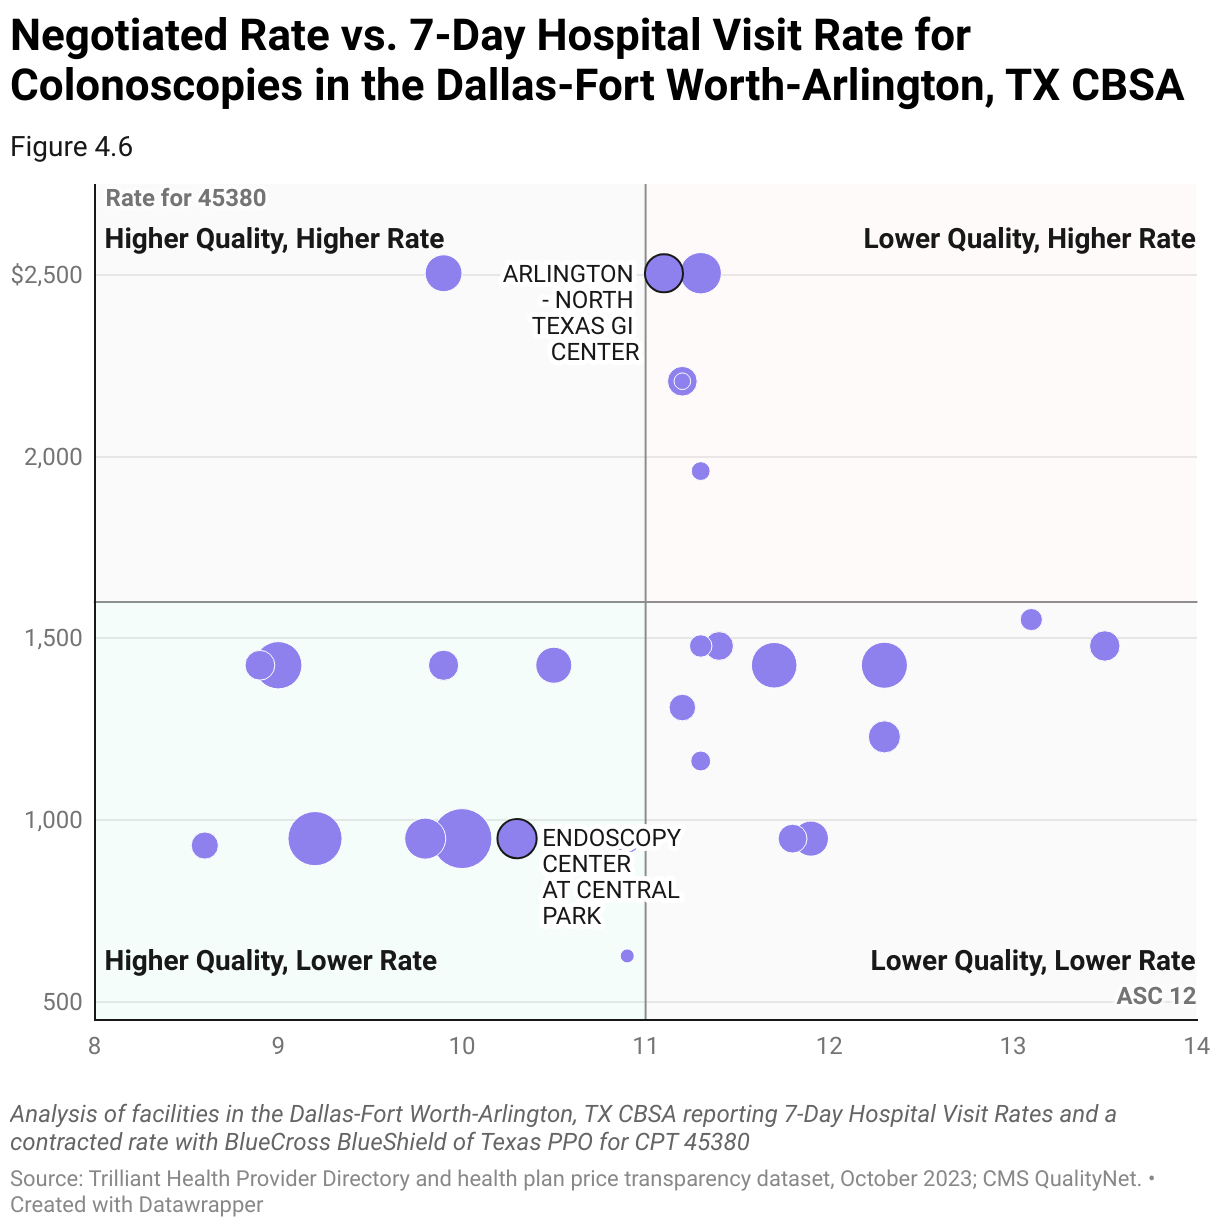
There is no value for money proposition in offering worse than average quality at any rate, especially one that is higher than the median market rate.
In this example, using a combination of provider directory, CMS QualityNet and health plan price transparency data, analyzing the relative value delivered by facilities performing outpatient diagnostic colonoscopies in the Dallas-Fort Worth-Arlington, TX CBSA suggests that employers could generate value for money by disincentivizing employees from utilizing the Arlington - North Texas GI Center and incentivizing them to utilize the Endoscopy Center at Central Park.
Use Case: Comparing Negotiated Rates Across Settings of Care and Health Insurers
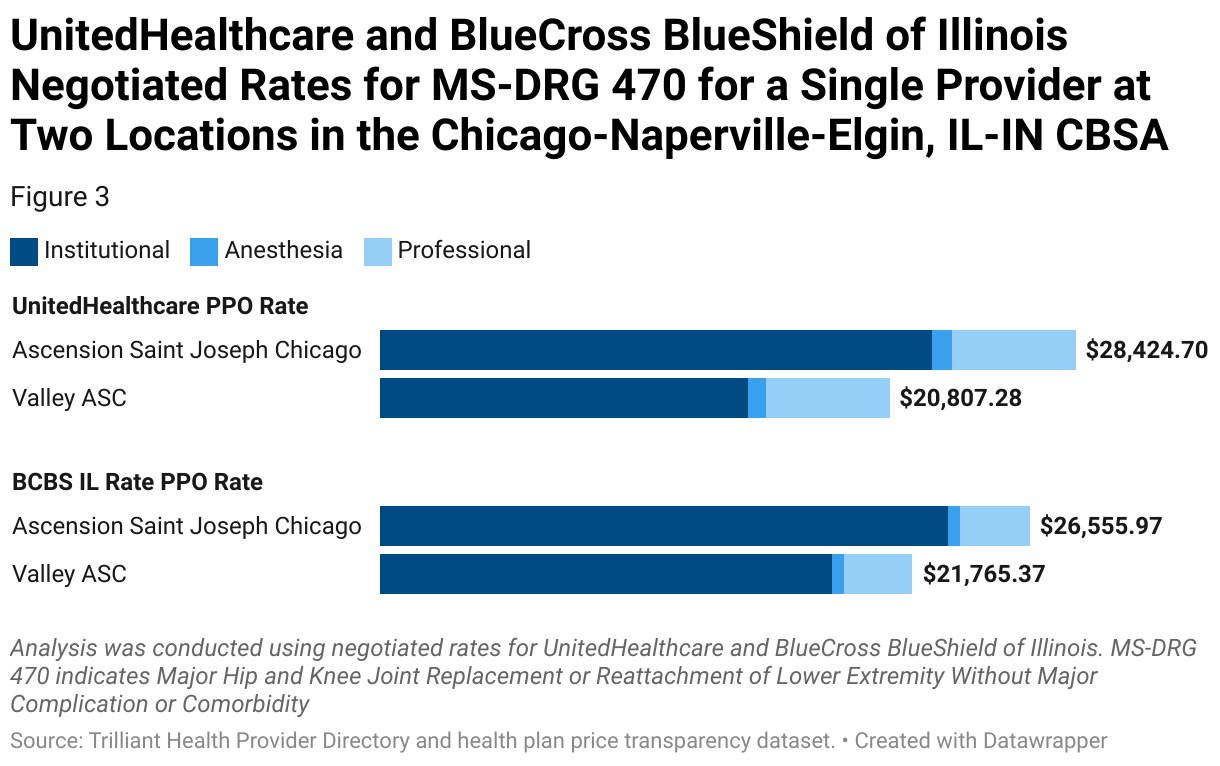
The cost of an identical service performed by the same physician can vary significantly based on the site of care and the patient’s health insurer.
In this example, using a combination of provider directory, claims data and health plan price transparency data, the difference in total cost of care for a knee replacement performed by the same physician varies by more than 35% depending on the site of care and the health insurer.
Use Case: Choosing a Health Plan on Value
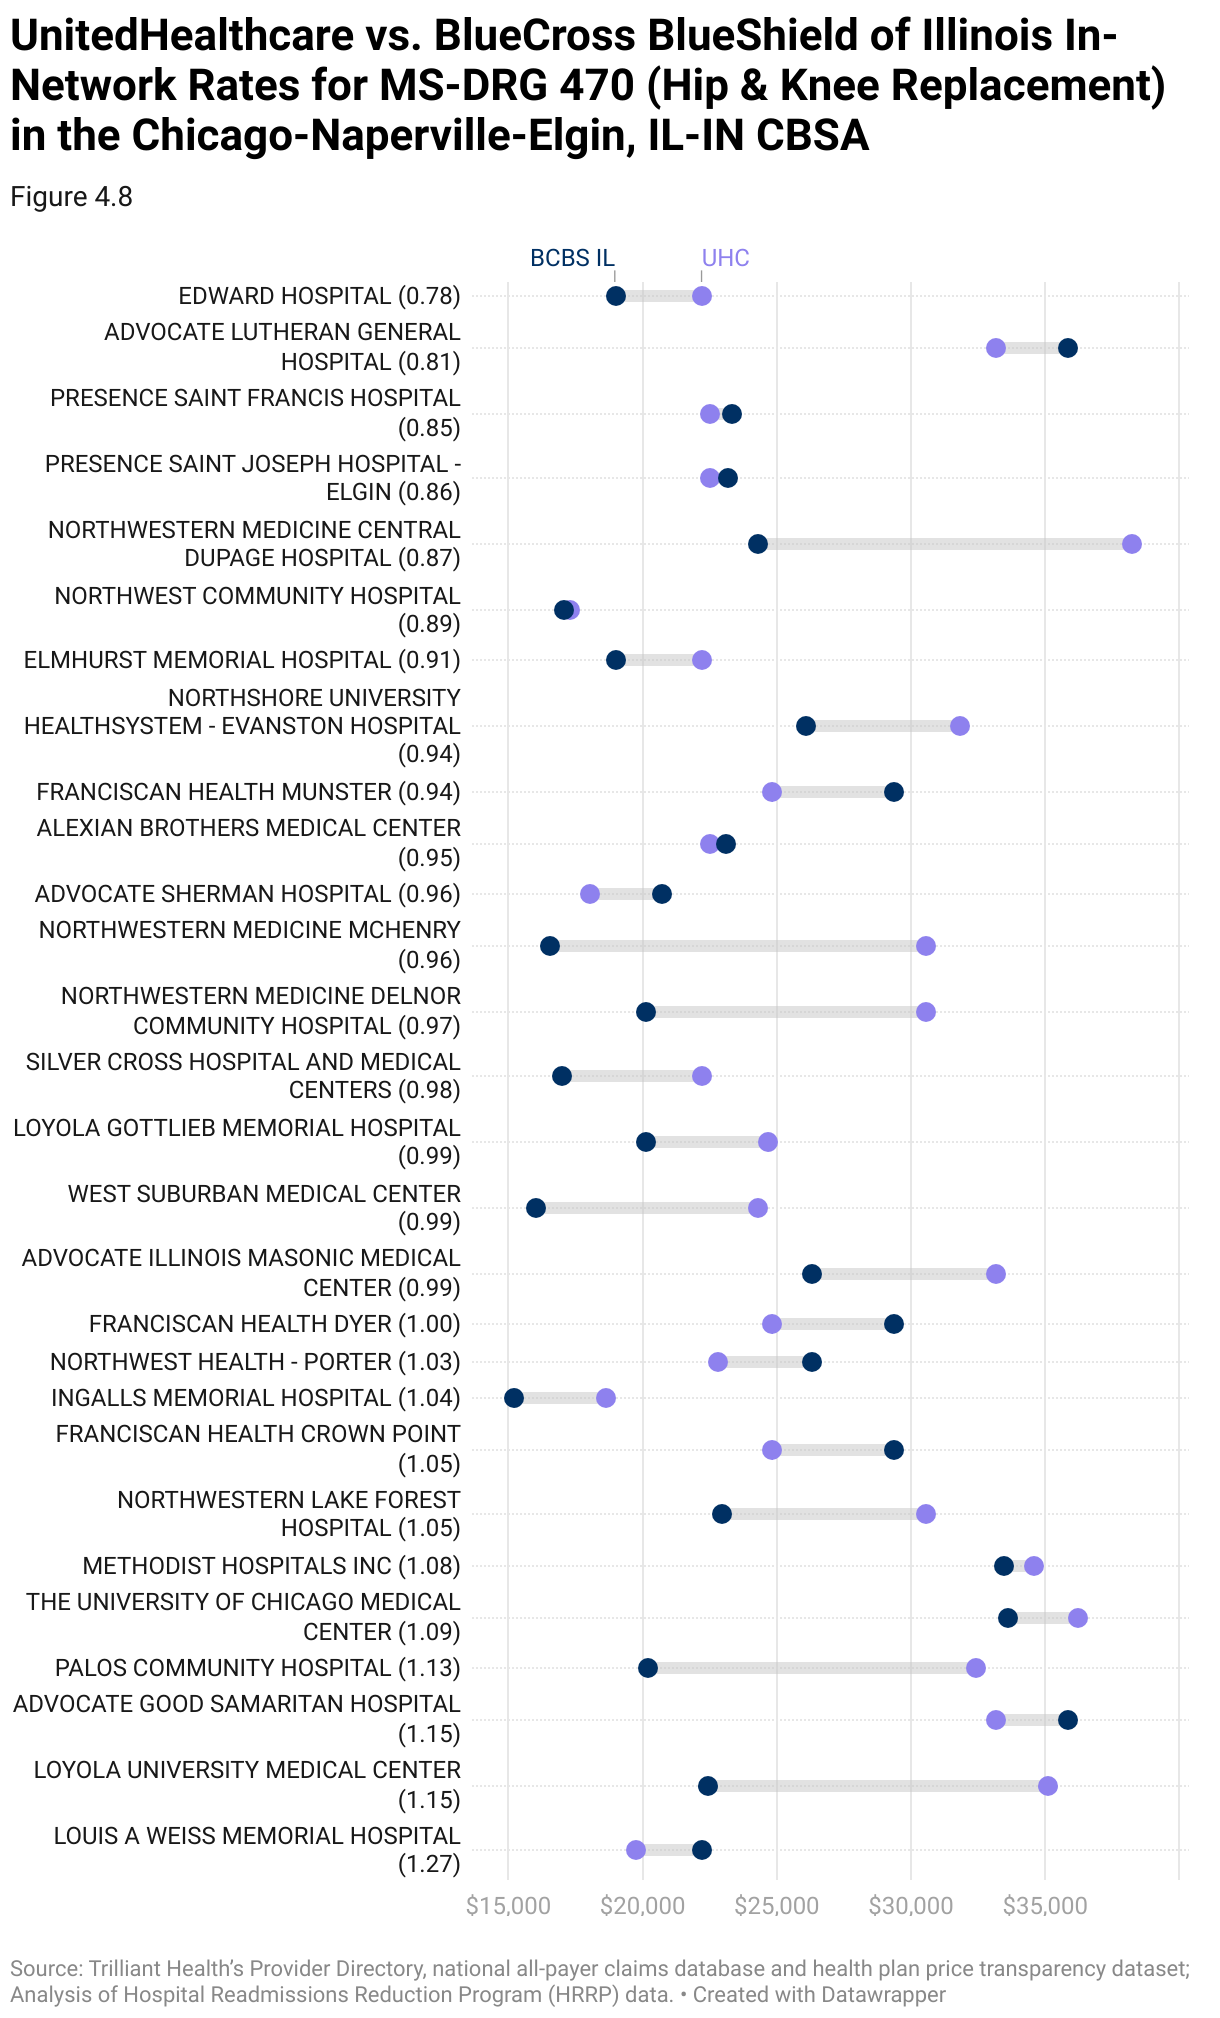
As detailed in the Introduction, negotiated rates for the same plan for the same service in the same market are widely divergent, but there is no observed correlation between price and quality in healthcare services at the national level.
In this example, using provider directory, utilization, CMS QualityNet and health plan price transparency data, for joint replacements without major complications or comorbidities – MS-DRG 470 – there are 19 hospitals in the Chicago-Naperville-Elgin, IL-IN CBSA that are in-network with UnitedHealthcare performing the procedure at or below the market mean negotiated rate of $24,362, of which 15 have expected or better-than-expected quality outcomes. Similarly, for joint replacements with major complications or comorbidities – MS-DRG 469 – there are 20 hospitals in the Chicago-Naperville-Elgin, IL-IN CBSA that are in-network with BCBS IL performing the procedure at or below the market mean negotiated rate of $41,108, of which 17 have expected or better-than-expected quality outcomes.
Steps to Direct Employees Away from Lower-Value Care Settings to Higher-Value Care Settings
- Employee Utilization Analysis
Gather internal data on healthcare utilization patterns among employees, including information on the types of services utilized, frequency of visits, costs incurred and outcomes. Analyze historical claims data to identify trends, high-cost procedures, frequent conditions and common healthcare needs among the employee population.
- Analyze Facility and Provider Quality
Utilize external market data to assess performance at the facility and individual provider level based on quality metrics such as patient mortality, readmission rates, infection rates, patient satisfaction scores and adherence to clinical guidelines. Identify facilities and providers that consistently deliver higher-value care at the service line and procedural level.
- Evaluate Value for Money
Leverage external rate data to assess settings of care based on value for money, comparing facility and provider quality to cost metrics including negotiated rate per procedure, average cost per episode of care and overall cost.
- Analyze Employee Preferences
Conduct a root cause analysis to understand factors contributing to the utilization of lower-value settings of care. Evaluate how demographic and psychographic profiles impact the preferences and behaviors of employees and identify segments that are at high risk of seeking care at lower-value facilities. Based on the findings, develop strategic initiatives to educate employees on the benefits of avoiding lower-value care settings and choosing higher-value care settings, to improve care navigation and to ensure convenient access to higher-value facilities. Seek opportunities to collaborate with health plans, third-party administrators and other healthcare partners to leverage their expertise and resources.
- Optimize Benefits Design
Assess how benefits can be designed to steer employees away from lower-value facilities in each market. Work with third-party administrators and health plans to implement tiered benefits to incentivize higher-value care and disincentivize lower-value care.
- Implement Care Navigation Efforts
Consider how employees might be equipped with information about cost and quality in real time as they make decisions about their healthcare. Evaluate online opportunities, such as scheduling platforms and employee portals, to make information more accessible.
- Network Monitoring and Optimization
Implement systems for ongoing monitoring of provider and facility performance, including quality metrics and cost-effectiveness. Regularly review claims data and feedback from employees to identify areas for improvement and opportunities to optimize the network.