Physician Strategies for Healthcare Providers
The supply of physicians is often inadequate to meet the demand for their services, not only in rural markets but also in suburban and urban communities. When designing provider networks, stakeholders need to attract, hire and retain physicians and allied health professionals based on current and future market needs. Longstanding workforce issues (e.g., an aging workforce, burnout) were exacerbated by the pandemic and ensuing “Great Resignation.” Traditional providers like health systems and physician groups must now compete for a shrinking pool of talent against digital health firms, life sciences firms, payers, consulting firms and, more recently, retail-based providers.
In addition to workforce planning and recruitment, provider organizations must continually evaluate network performance. While the terminology varies – network integrity, patient retention, referral leakage – the business goal is the same: to optimize the provider network by keeping referrals of commercially insured patients, especially by employed physicians, within the system. The more financial exposure the organization has to value-based reimbursement models, the more important that network performance becomes.
Stakeholders at provider organizations must answer the following questions to develop effective physician network strategies:
- Who are all the healthcare providers, including facilities, physicians, allied health professionals, “payviders” and digital health firms, operating in the target market?
- In the target market, how does the demand for services correlate with the supply of providers who are qualified to deliver those services, based on their specialties and credentials?
- How might physician supply evolve in the target market due to changes in the workforce, such as career change, graduation, retirement and shifts to part-time employment?
- How might the supply of facilities evolve in the target market due to demographic, economic, technological or regulatory changes?
- Is the stakeholder’s physician network adequate to meet the healthcare needs of its customers in the target market?
- Is the stakeholder’s physician network adequate – and aligned – to leverage its strengths and strategic objectives?
- What physician specialties are over-supplied in the target market? What physician specialties are under-supplied in the target market?
- What is the stakeholder’s share of all referrals from its employed or affiliated primary care provider network?
- Where do primary care providers refer patients for care outside of the stakeholder’s network? Are the specialists in the stakeholder’s network well-suited to manage referrals from its primary care provider network?
- Where do specialists in the stakeholder’s network render care? What high-margin business is out-migrating to competitive hospitals, surgery centers or clinics? What about follow-up care?
- How can the stakeholder strengthen its network through alignment with independent physicians, whether through employment, affiliation or strategic partnerships?
- How well is the stakeholder’s physician network aligned with value-based reimbursement models?
- How will current and future policy and payment trends influence the growth opportunities for the stakeholder’s services in the target market?
Use Case: Physician Needs Assessment for Medical Cardiology
Provider organizations should design their physician networks with an understanding of how demand for healthcare services correlates with the supply of physicians who are qualified to deliver those services, based on their specialties or credentials. With an accurate understanding of supply and demand in local markets, the provider organization can identify underserved areas and better align its network to meet the current and future needs of the population.
Calculating the shortage or surplus of physicians in a market requires an understanding of the area’s total addressable market (TAM) for healthcare services (see our section on Market Share). The analysis can be conducted at a regional, local or hyper-local level.
In this example, using a combination of provider directory, utilization and consumer data, a physician needs analysis reveals a shortage of 7.54 medical cardiologists across the example health system’s service area. However, access varies across markets in the service area, with Grand Rapids having the largest physician surplus, while Holland is most underserved.
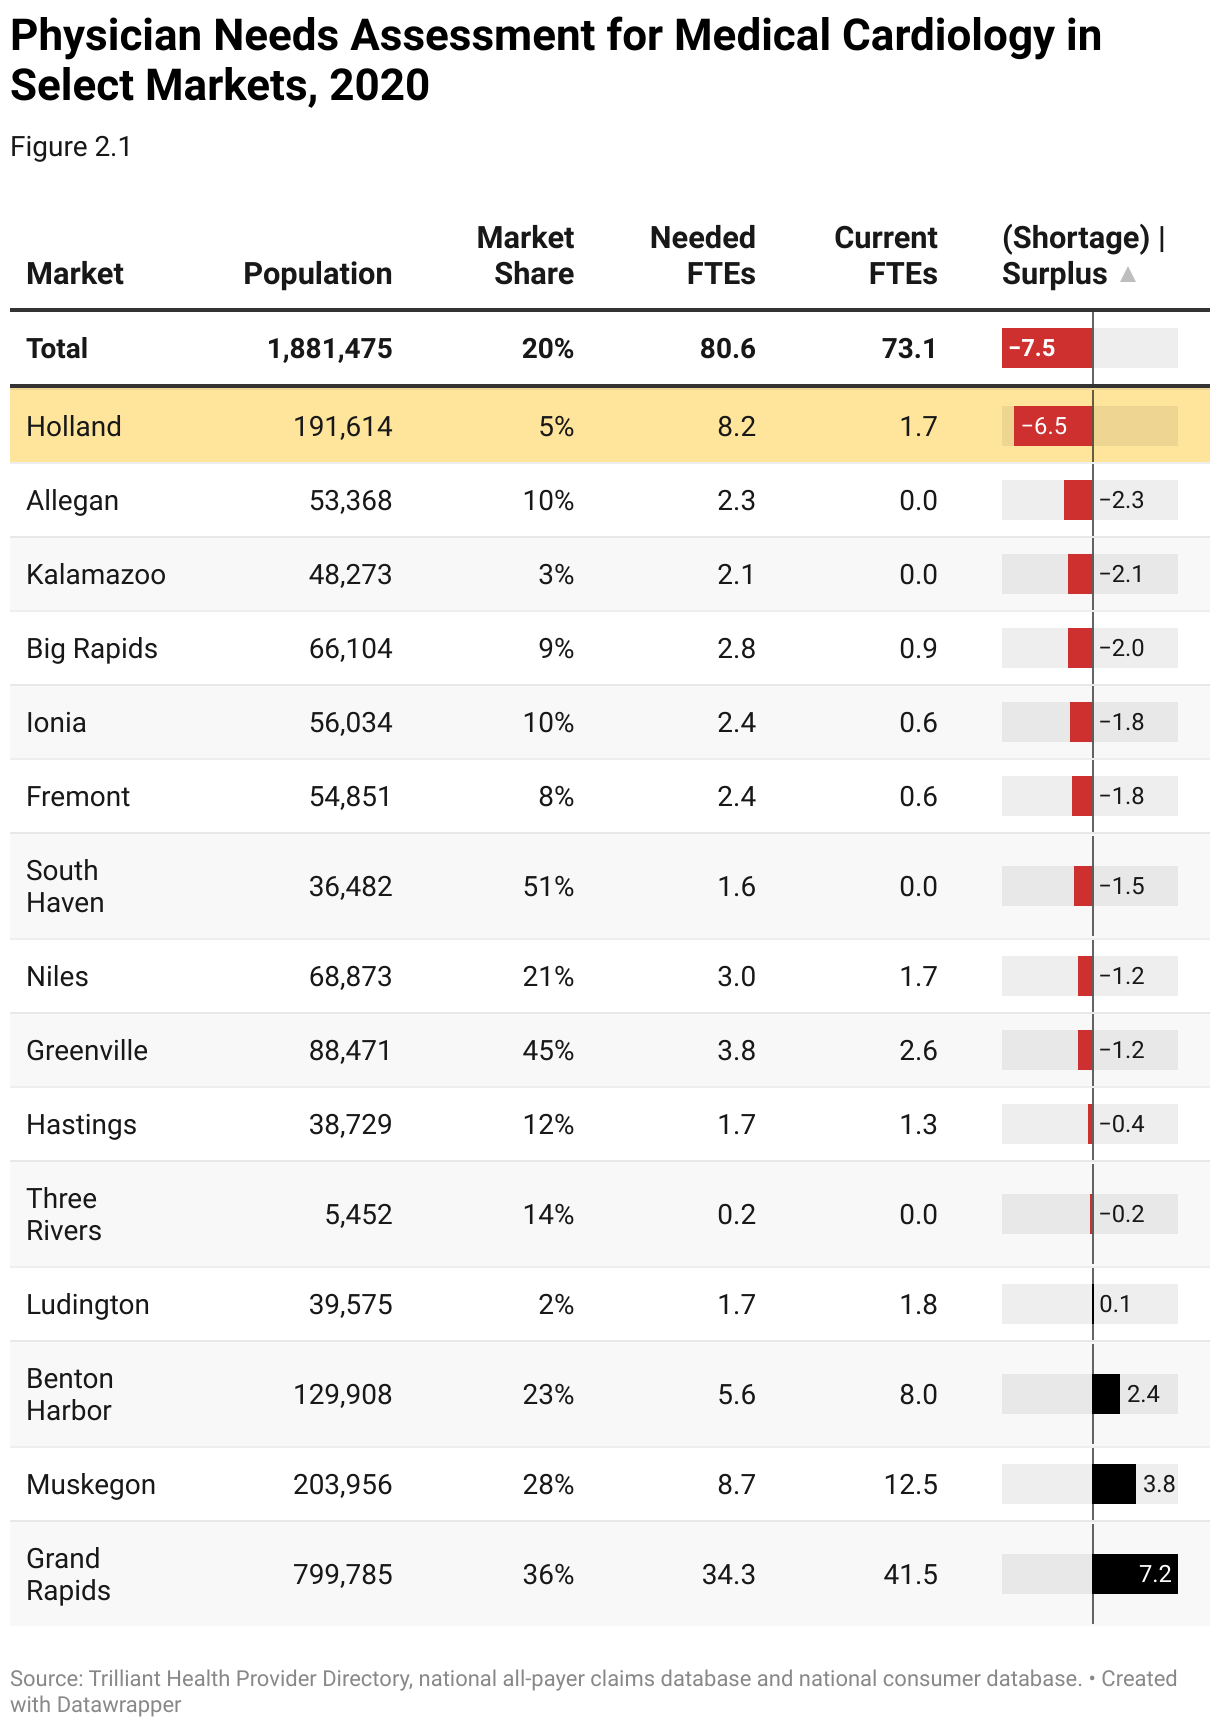
Markets with a surplus of medical cardiologists, such as Grand Rapids, are not ideal for expanding cardiology services, as the markets are already overserved and likely to be highly competitive.
In contrast, the Holland market is underserved for medical cardiology, with an additional 6.5 medical cardiologists needed to support the population. The health system has only a 5% market share in Holland, making it a compelling expansion opportunity. By understanding how healthcare supply aligns with demand for services at the local level, provider organizations can develop an action plan to address service gaps at the hyper-local level.
Steps to Conduct a Physician Needs Assessment
- Internal Planning
Clearly define the objectives and scope of the provider needs assessment, including the target specialties to be assessed and the definition of the primary and secondary service area. Gather feedback from service line leaders on current staffing levels and larger market need. Consider how new technology might change workforce roles and functions. Research benchmarking data to compare and predict organizational need against similar facilities and markets.
- Curate Market Data at the ZIP Code Level
Gather external data sources that inform inpatient and outpatient demand and supply for healthcare services, including:
- Demographic data, with current-year population and five-year population projections
- Real-time utilization and prevalence of disease incidence rates by ZIP Code
- Current provider supply including specialty, age, panel size and FTE breakout by location
- Benchmark provider-to-population ratios based on market similarity
- Patient loyalty and care migration patterns by medical specialty
- Analyze Competing Networks
Analyze the competitive landscape for each medical specialty within the primary and secondary market, including competing healthcare systems, independent practices and other providers. Calculate provider alignment to better understand the downstream volume capture for key specialties.
- Geospatial Assessment
Utilize geospatial data to map and visualize provider distribution and identify geographic pockets that are underserved or lacking access to certain medical specialties. Segment market access by medical specialty and facility type.
- Identify Service Gaps
Analyze current population, utilization and provider-to-population ratios within the primary and secondary market to identify the demand for each medical specialty. Identify service gaps and areas of unmet need by calculating:
- Demand using census population and benchmark provider-to-population ratios
- Current supply (total FTE count) using actual volume by site of service (% of FTE)
- Patient loyalty by specialty
- Create Action Plan
Prioritize market demand and service gaps based on patient care impact, strategic importance, profitability and feasibility. Develop an action plan to address the identified needs and service gaps, including strategies for recruiting and retaining healthcare providers, expanding services and enhancing support infrastructure.
Use Case: Network Integrity/Referral Leakage for Employed PCPs
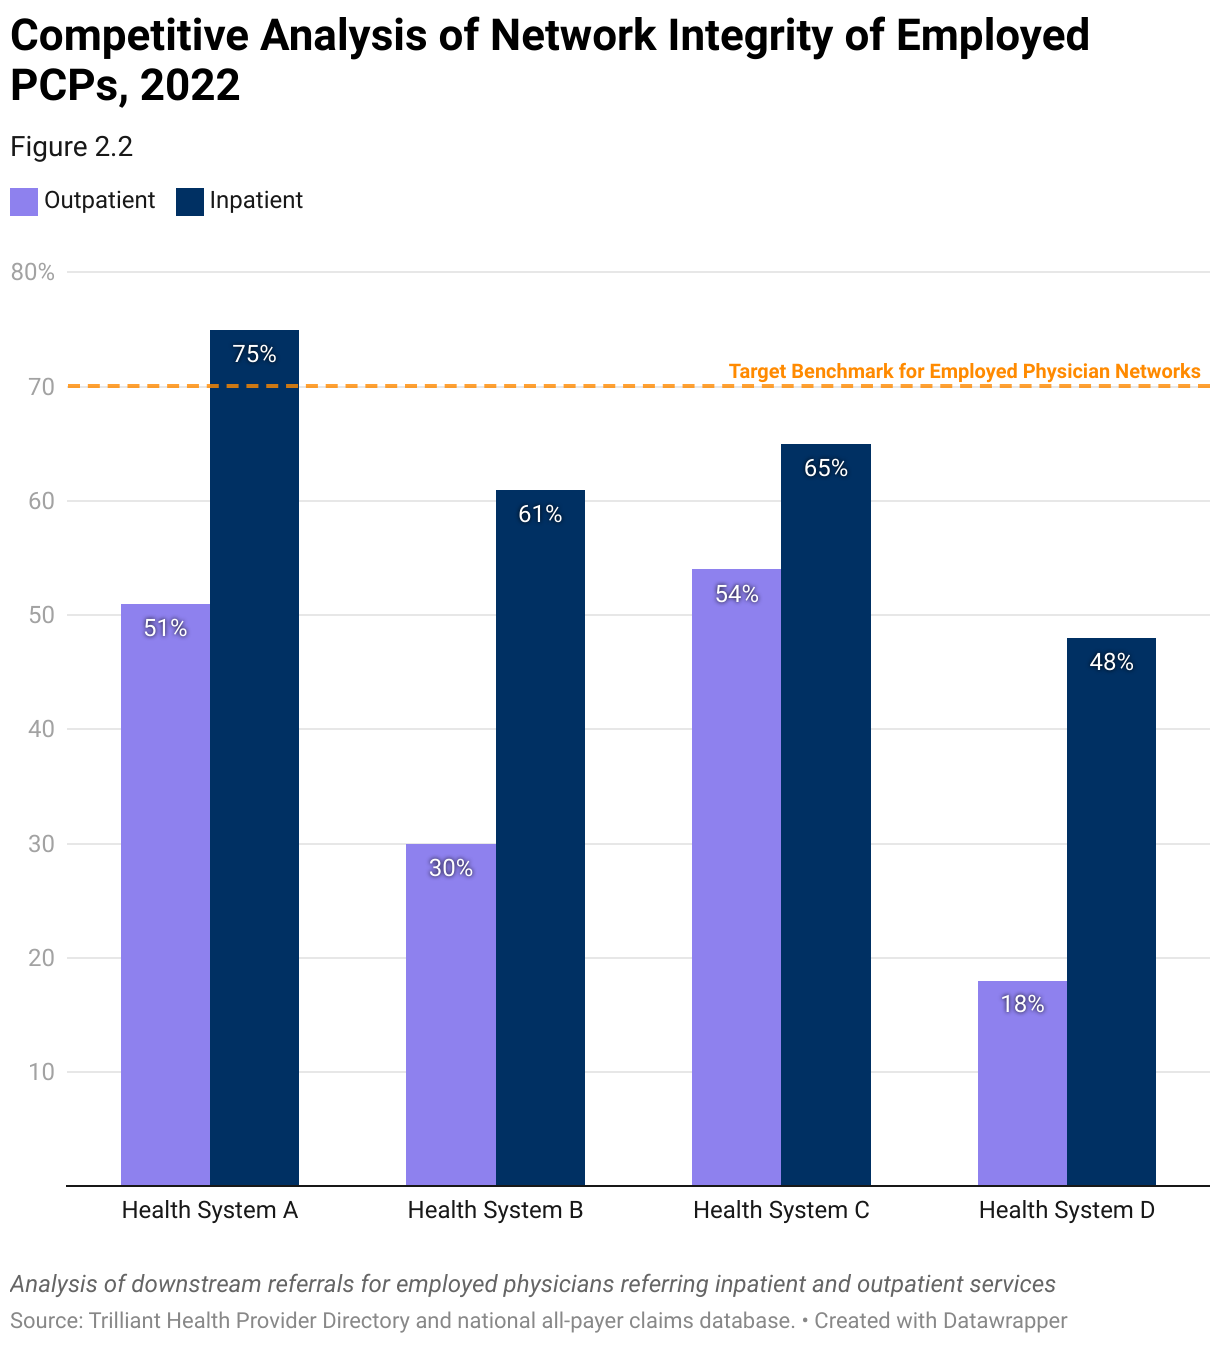
Every provider organization with a network of employed or affiliated primary care providers (PCPs) must understand how PCP referral patterns influence the organization’s network performance. First, the stakeholder must know their share of all referrals from their provider network. High-performing networks retain more than 70% of downstream care in-network, with clinically integrated networks commonly outperforming the benchmark.
In this example, using a combination of provider directory and utilization data, an analysis of network integrity across inpatient and outpatient care reveals significant opportunities across all health systems in the market. Outpatient network integrity ranges from 54% at “Health System C” to only 18% at “Health System D,” and inpatient network integrity ranges from 75% to 48%. Only “Health System A” performs above the 70% benchmark, but only for inpatient services.
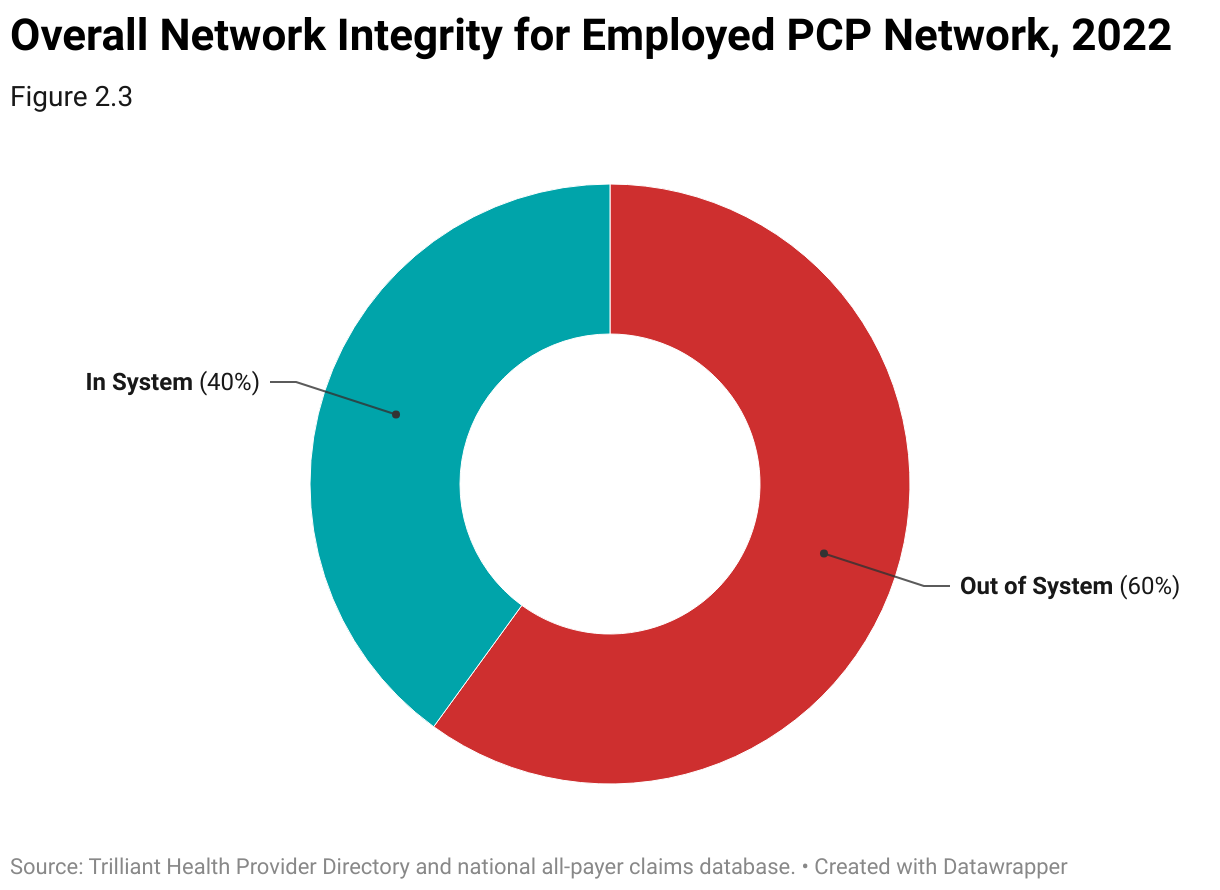
Health systems can quantify the financial impact of improved network integrity by calculating lost revenue due to out-of-network referrals across markets, physician groups, service lines, procedures and settings of care.
In this example, using a combination of provider directory, utilization and health plan price transparency data, the health system retained only 40% of downstream services from their employed PCP group over a two-year period. By improving network integrity from the current 40% to the 70% benchmark, the health system could increase revenue by $12M.
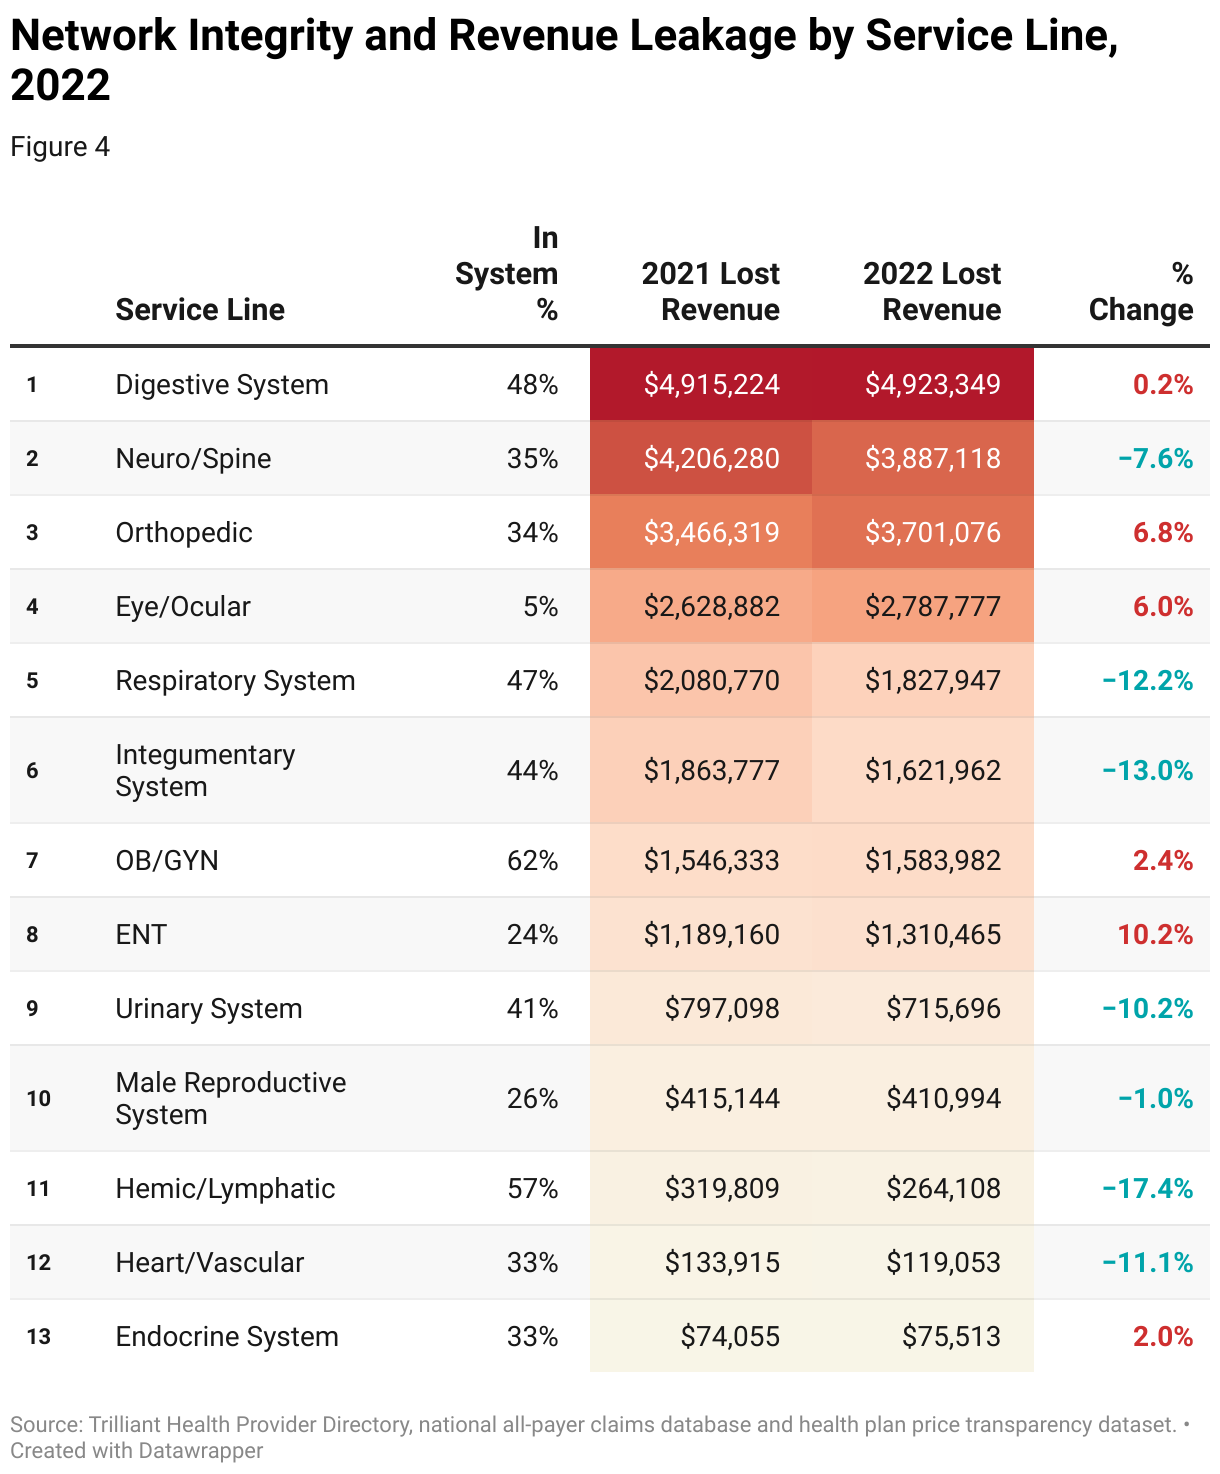
The health system’s network integrity varies across service lines, led by the OB/GYN service line (62% share of referrals). The health system’s share of downstream care was lowest for Eye/Ocular (5% share), followed by ENT (24%), Male Reproductive System (26%), Heart/Vascular (33%), Endocrine (33%) and Orthopedic (34%).
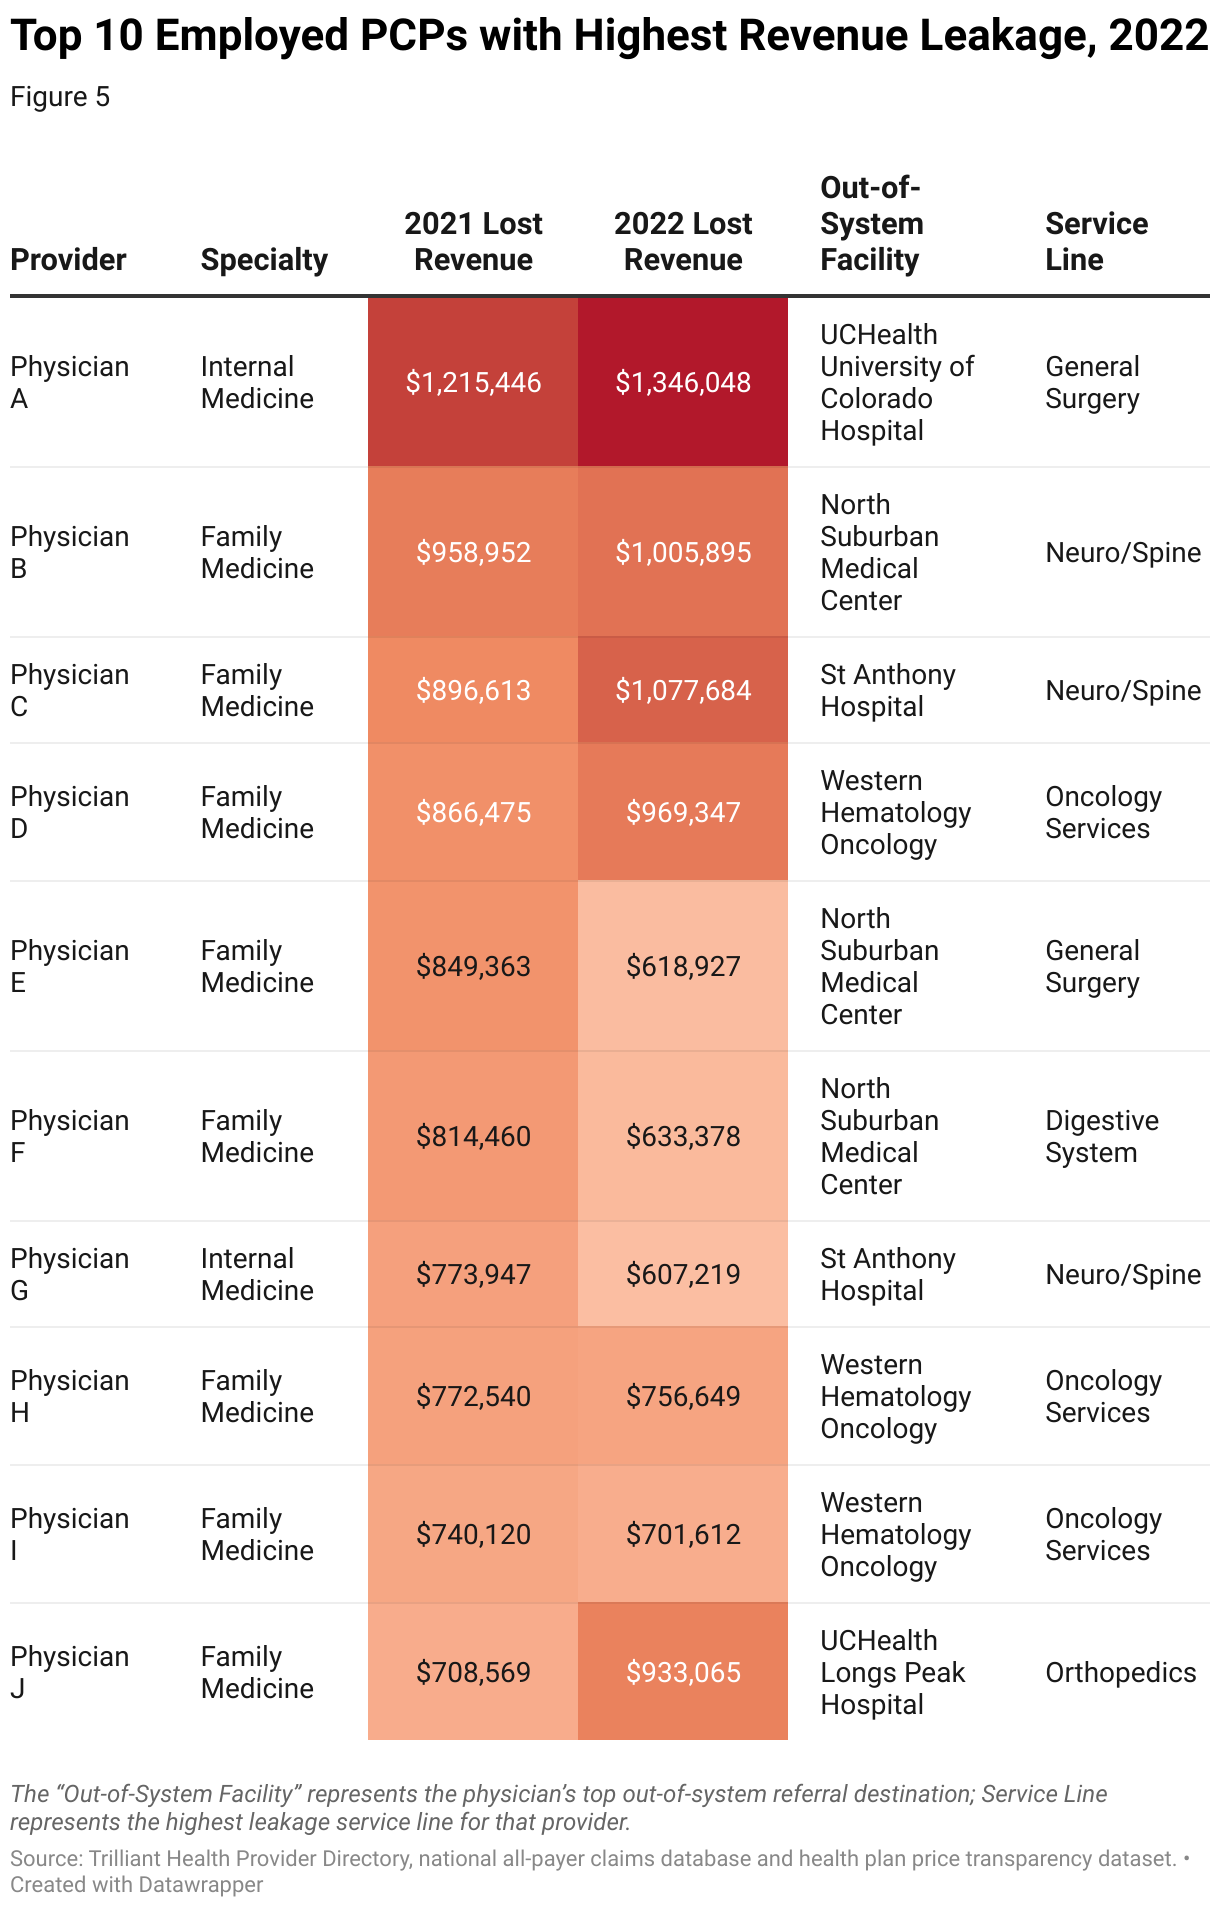
For most health systems, Eye/Ocular is not a strategic priority because care is usually rendered in physician offices and outpatient centers. However, the root cause of low network integrity for orthopedic services should be investigated immediately, representing more than $3.7 million in lost revenue in 2022.
By conducting analysis at the physician level, provider organizations can deploy resources for direct discussion with physicians in their network to better understand the root cause of leakage. In this example, Physician A referred more than $1.3 million in downstream surgical cases out-of-network. With an in-depth understanding of the physician’s out-of-network referrals, physician liaison teams can solicit feedback from the provider, identifying opportunities to improve network performance.
Steps to Perform a Network Integrity/Referral Leakage Analysis
- Internal Planning
Meet with service line leaders and key stakeholders to define specific metrics and goals related to the performance of the employed medical group, including establishing internal benchmarks for patient retention rates, standard referral pathways, referral leakage rates (patients seeking care outside the system) and patient satisfaction.
- Curate Internal Data
Collect relevant data from internal sources such as employed physician rosters, referral tracking data and patient satisfaction surveys, including patient demographics, detailed provider information (name, NPI, specialty, etc.) and patient feedback.
- Curate External Market Data
Normalize external data to align with internal network definitions, including classifying physicians and facilities based on system ownership. Determine key metrics for standard network integrity reporting. Common metrics include referral capture, procedures performed and total downstream revenue capture.
- Assess Network Performance
Analyze the collected data to calculate key performance metrics related to network integrity. Limit the initial analysis to the patients treated by employed providers. Track and monitor the longitudinal journey of each patient to identify gaps in the employed physician network and quantify the amount of patient outmigration across key services. This may involve calculating overall patient retention and referral leakage percentages by service line. Use statistical analysis to identify larger network trends and patterns in the data at the individual physician level.
- Calculate Competing Network Performance
Analyze the collected data to calculate key performance metrics related to competing hospital-owned or employed medical groups that are similar in size and specialty mix, including groups within the primary service area or similar systems in the region or industry. Compare physician group performance metrics against competing networks, as shown in Figure 2. Analyze the differences and similarities in network integrity measures, such as patient retention rates and referral leakage by service line, as in Figure 4. Identify areas where network performance excels and areas for improvement compared to the competing networks.
- Root Cause Analysis
Conduct a root cause analysis to understand factors contributing to network performance. This should include evaluating factors such as access to care, physician-patient communication, service line capability (robotic surgery, etc.), care coordination, physician engagement and external factors affecting patient choice. Based on the findings, develop strategic initiatives to improve care coordination and communication among physicians, expand access based on the needs of the community and strengthen relationships with referring physicians.
- Monitoring and Continuous Improvement
Continuously track and analyze key performance metrics related to network performance to assess progress and make necessary adjustments to performance improvement initiatives. Foster a culture of continuous improvement within the system by regularly reviewing performance metrics, soliciting feedback from physicians and patients and identifying opportunities for further optimization of network integrity and overall performance.
Use Case: Strategic Alignment with Independent Specialists
Provider organizations can apply a similar framework to understand the alignment of independent specialty care practices.
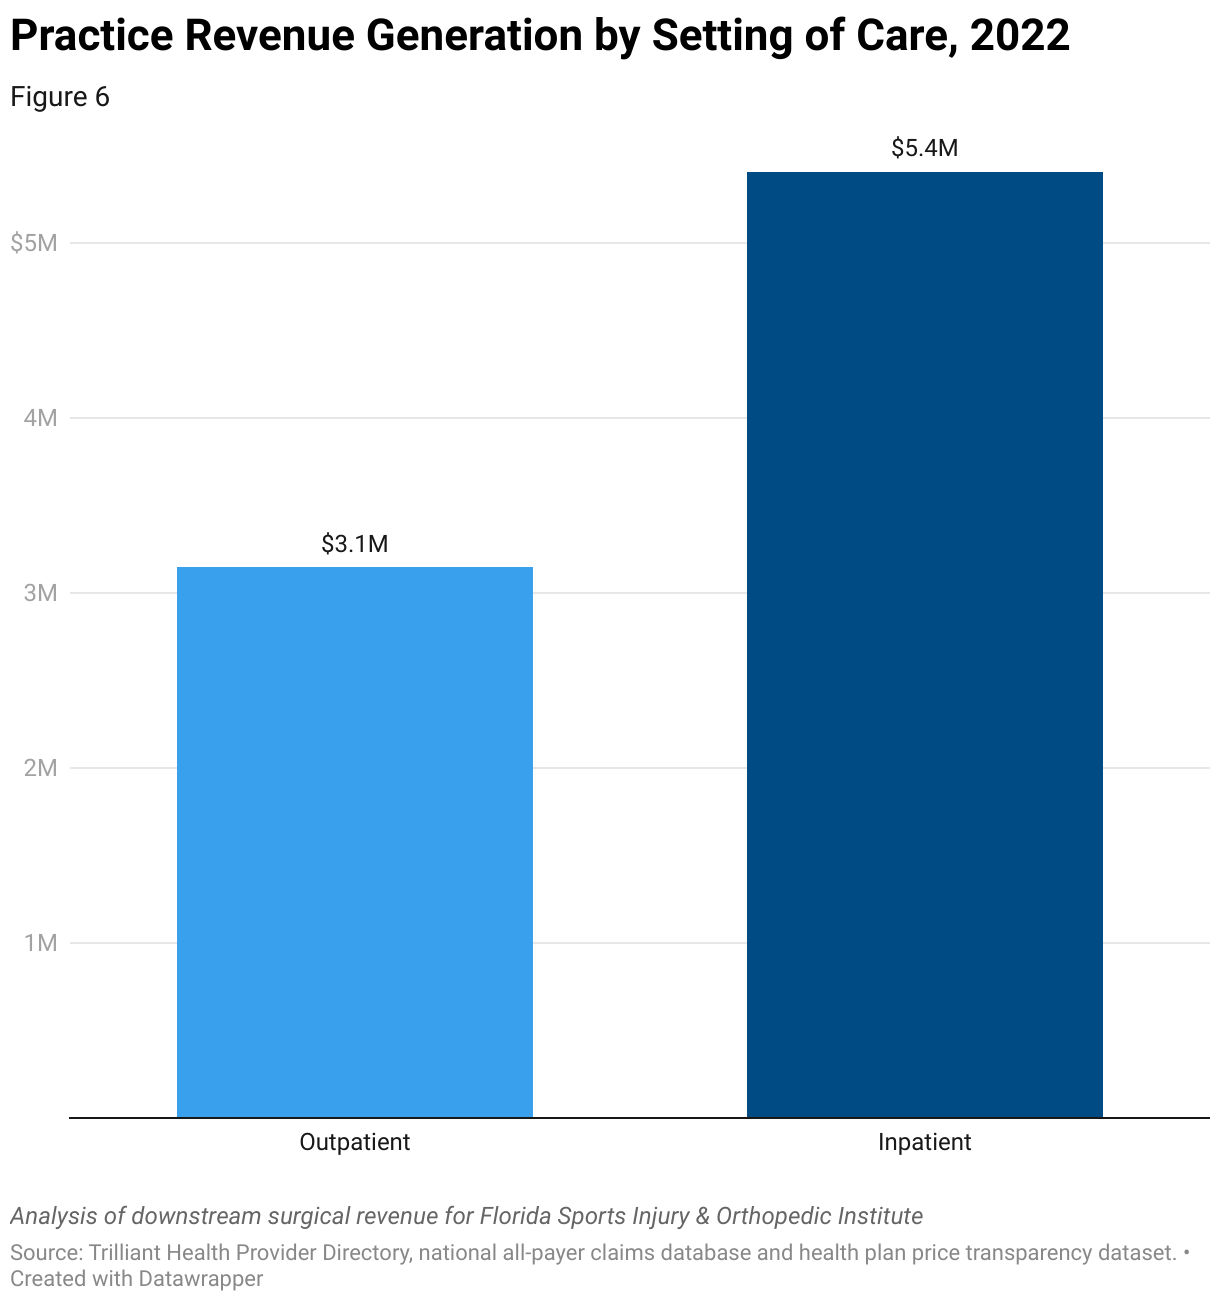
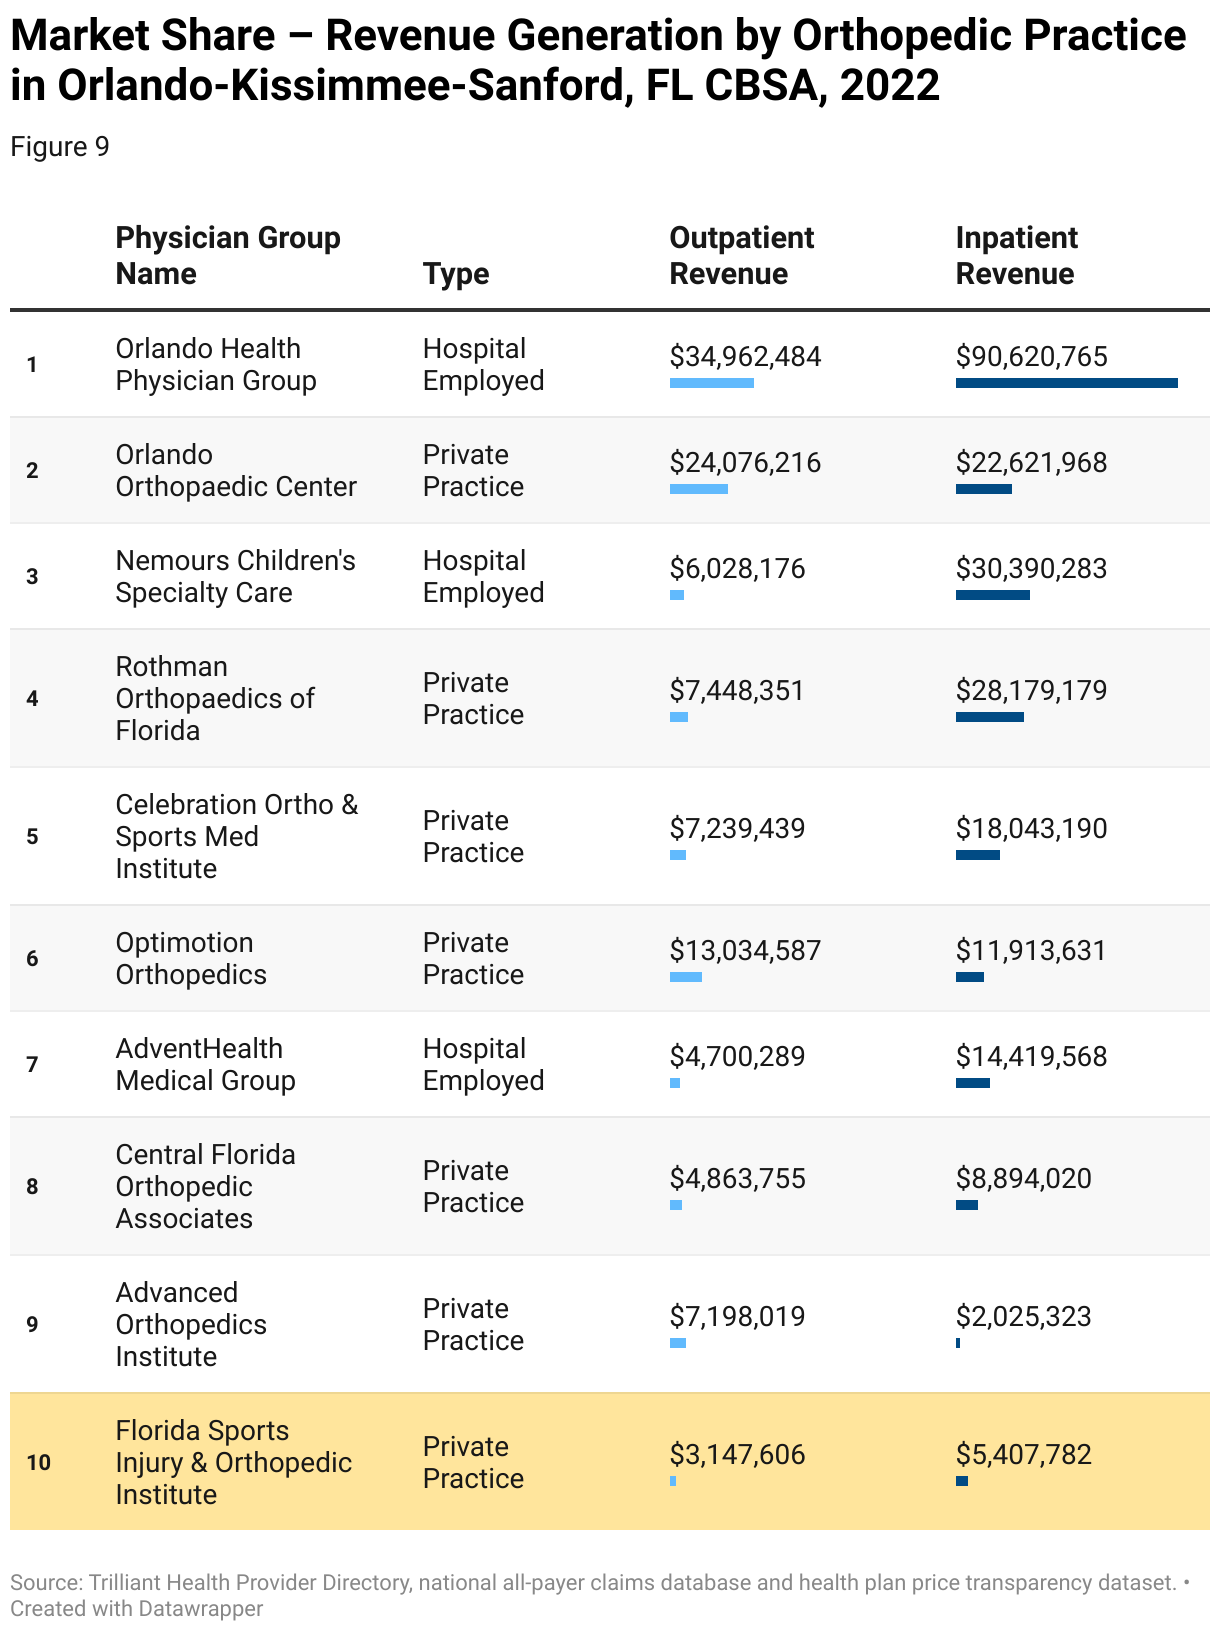
In this example, using a combination of provider directory, utilization, and health plan price transparency data, an independent practice, Florida Sports Injury and Orthopedic Institute, is analyzed to quantify its share of downstream referrals. The target practice is one of the largest independent orthopedic groups in the Orlando-Kissimmee-Sanford, FL CBSA, generating over $8.5 million in downstream surgical revenue in 2022.
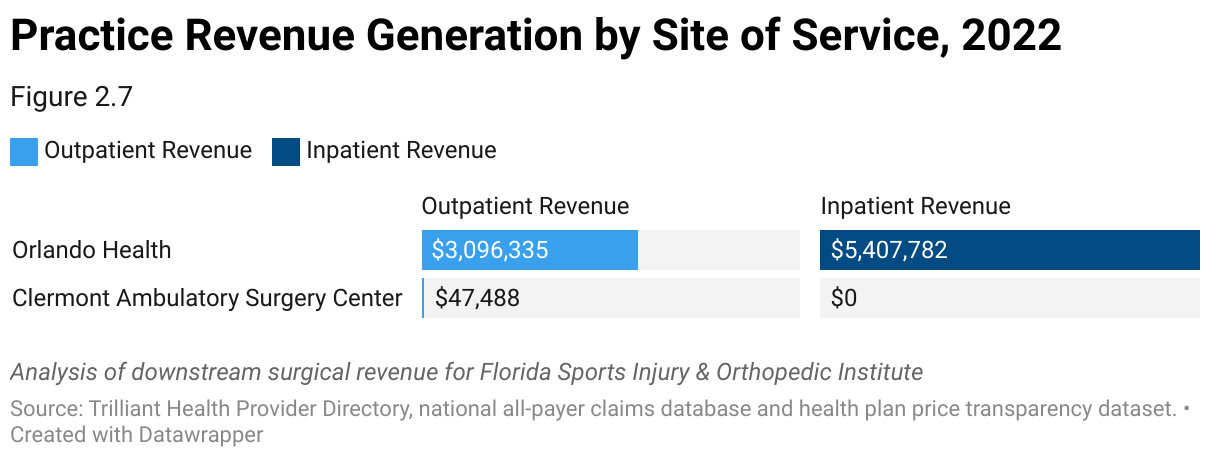
The target practice is highly aligned with Orlando Health, with more than 98% of downstream surgical revenue rendered at an Orlando Health facility. While the practice is not affiliated with Orlando Health, its referral patterns reveal a high level of satisfaction with that relationship, and other health systems may have difficulty overcoming the strength of the relationship with Orlando Health. Through in-depth analysis of the practice, competing health systems can assess partnership strategies that align with the independent provider group’s priorities.
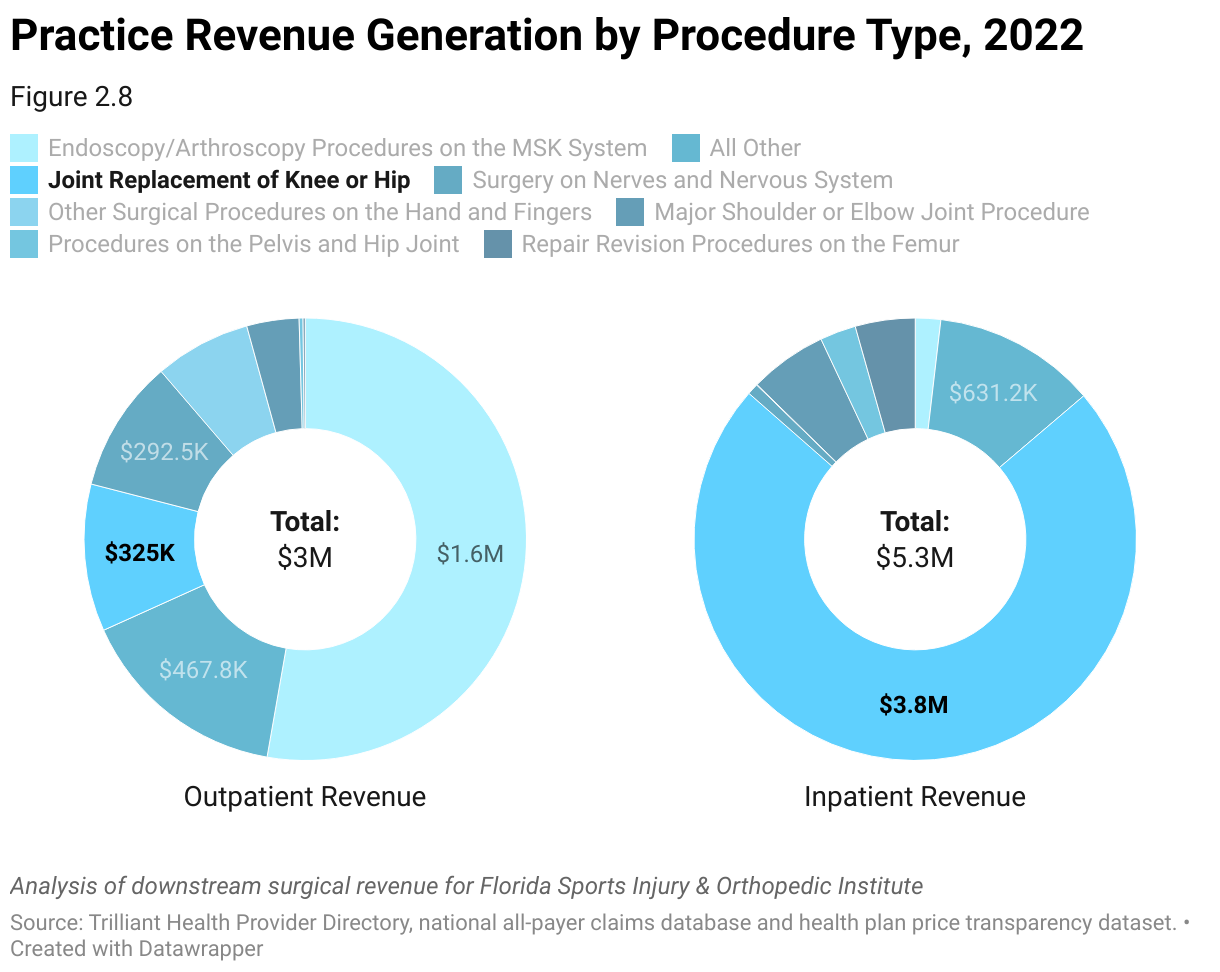
An analysis of the procedures performed by Florida Sports Injury and Orthopedic Institute suggests that the group focuses on hip and knee surgeries (Figure 8). Even though the group is highly aligned with Orlando Health, the increasing migration of joint replacements to outpatient settings, particularly for commercially insured patients, will potentially impact Orlando Health’s revenue, as outpatient surgeries are reimbursed at lower amounts than equivalent inpatient surgeries.
Steps to Align with Independent Specialty Groups
- Internal Planning
Work with service line leaders and key stakeholders to create an outreach plan that is tightly aligned with the long-term growth strategy of the organization. Analyze utilization data to identify service gaps or areas of high demand that align with the services offered by independent provider groups. Design initiatives and outreach around target service line expansion opportunities. Consider how new technology and recent service line investments might impact short-term opportunities to grow volume and increase alignment with key independent providers.
- Curate Internal Data
To the extent available, collect relevant data from internal sources about volumes of care delivered by independent physician groups within and outside the network.
- Curate External Market Data
Normalize the data to align with internal service line definitions and classifications. Segment the market based on provider specialties, geographical locations and provider group classifications, including classifying providers based on their ownership status (hospital employed vs. independent practice). Determine key metrics for standard reporting. Common metrics include physician loyalty and downstream revenue opportunity.
- Analyze Practice Patterns
Identify large independent provider groups in the service area, including primary care physicians, specialists and other healthcare providers, and analyze physician loyalty patterns and predict trends in behavior through the analysis of referrals and downstream alignment. Quantify the downstream revenue opportunity and identify areas of leakage where patients are referred to competing facilities.
- Assess Provider Loyalty
Evaluate the strength of existing relationships with independent provider groups, including referral capture, collaborative initiatives and satisfaction levels. Segment provider groups based on key alignment categories:
- Highly Aligned: Downstream Referral Capture >70%
- Splitter: Downstream Referral Capture Between 30% and 70%
- Occasional User: Downstream Referral Capture Between 10% and 30%
- Not Aligned: Downstream Referral Capture <10%
- Prioritize Outreach Strategy
Work with service line leaders and key stakeholders to create an outreach plan aligned with the organization’s growth strategy. Prioritize outreach efforts towards independent provider groups with high referral potential and strong alignment with strategic priorities. Sophisticated evaluation identifies the best prospects for maximizing gains in volume and downstream revenue. Tailor outreach messaging around the specific needs, interests and concerns of each targeted provider group. Utilize various engagement channels such as in-person meetings, educational meetings, digital communications and referral management platforms to engage with independent providers effectively.
- Monitor Outreach Performance
Implement feedback mechanisms to gather insights from independent providers and continuously improve referral processes and support services. Solicit feedback from independent providers and adapt outreach strategies based on input and evolving market dynamics. Leverage external market data to monitor referral volumes, capture rates and trends over time to assess the effectiveness of outreach efforts. Continuously refine and optimize outreach strategies based on data-driven insights and feedback to maximize referral capture.