Physician Strategies for Health Plans
Nothing impacts a health insurer’s profitability more than their medical loss ratio (MLR), and nothing impacts their MLR more than the performance of their provider network. Traditionally, health insurers have focused primarily on network adequacy, i.e., whether the network has enough providers to deliver care, with less focus on the utilization and referral patterns of in-network providers. As healthcare inflation continues to increase and healthcare price transparency reveals wide variation in reimbursement rates from the same payer for the same service in the same market, payers need to focus on network performance, i.e., how efficiently do in-network providers perform?
Payer stakeholders must answer the following questions to develop effective physician network strategies:
- Who are all the healthcare providers, including facilities, physicians, allied health professionals, “payviders” and digital health firms, operating in the target market?
- What are the distinct utilization patterns, needs and preferences of the stakeholder’s members in the target market?
- Is the stakeholder’s provider network adequate to meet the healthcare needs of its members? What sites of care are over-supplied? What sites of care are under-supplied? What physician specialties are over-supplied? What physician specialties are under-supplied?
- Do the providers in the stakeholder’s network manage patient care similar to or different from the way they manage patient care for members of a competitor’s network?
- For care that can be rendered in an outpatient setting, what percentage of care do in-network specialists render in hospital outpatient departments versus ambulatory care settings?
- In the target market, what percentage of in-network providers render care that is below the expected value for quality measures?
- In the target market, what percentage of in-network providers are reimbursed above the market median rate?
- In the target market, what percentage of providers render average or above-average quality at rates that are at or below the market median rate?
- What role do “ghost networks” play in impeding access to care? Are all healthcare providers in the network available to see new members?
- How will current and future policy and payment trends influence provider network performance or MLR in the target market?
Use Case: Identifying Underserved Markets
When designing a provider network, health insurers need to understand whether provider supply in the market is adequate to meet member demand for services.
The challenges that health plans face when measuring network adequacy are well-documented. Numerous policy efforts are underway to address “ghost networks,” which occur when a physician is listed in a health plan’s directory but is not accessible to members for various reasons, whether because a physician is no longer practicing, changed specialties, moved or is not accepting new patients. To assess their network adequacy accurately, health plans must utilize a current provider directory that includes all physicians and allied health professionals in the market, as well as their locations, practicing specialties, patient panel demographics and productivity.
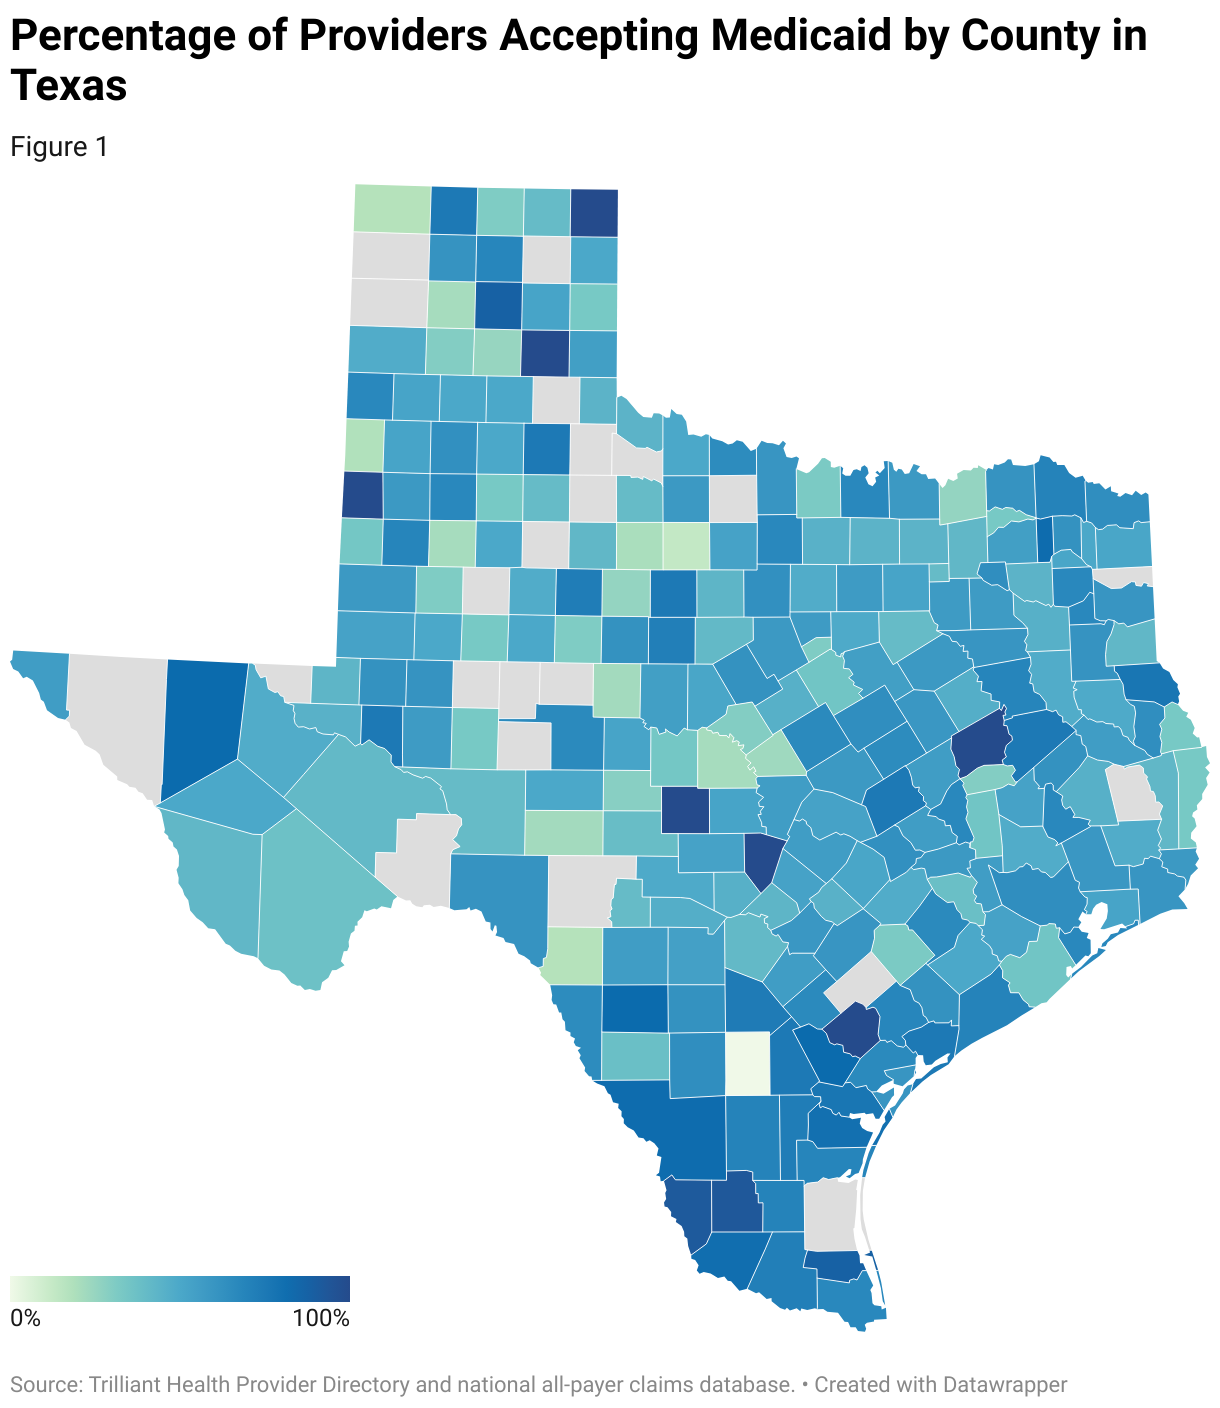
In this example, using a combination of provider directory and utilization data, the supply of physicians treating Medicaid patients in Texas is calculated at the county level, revealing that physician participation in the Texas Medicaid program is highly variable across the state. By analyzing provider utilization patterns, health insurers can identify potential gaps in their network (e.g., ghost networks) to ensure their network can meet demand for services in the target market.
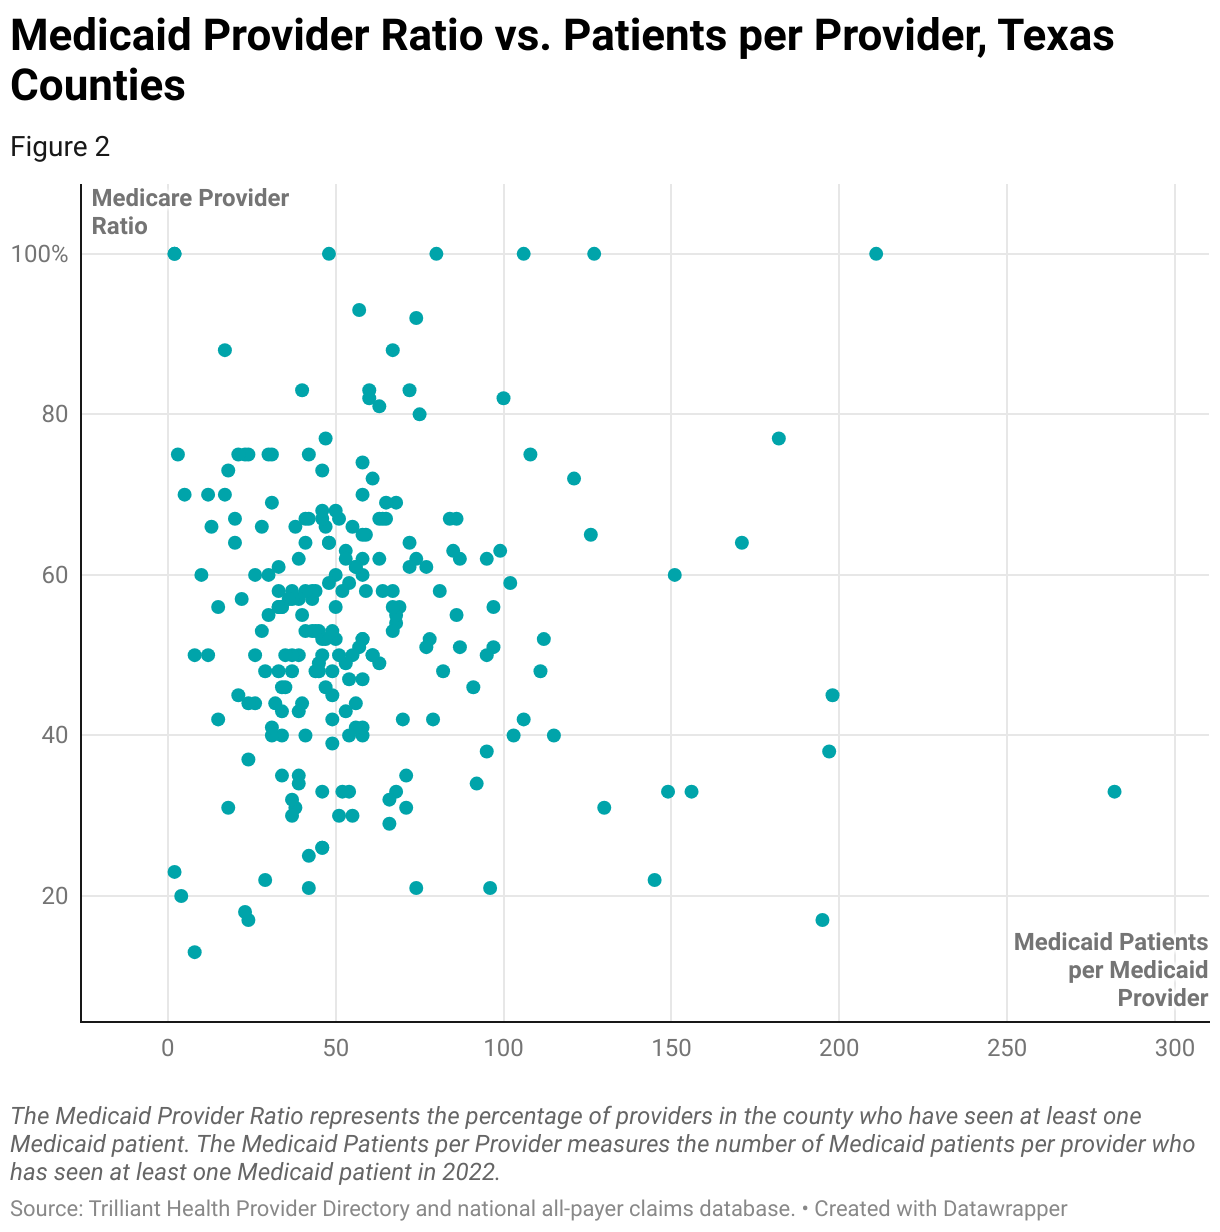
Health plans can also examine patient-to-provider ratios to assess whether the supply of healthcare providers in a market is adequate to meet demand from their members.
In this example, using a combination of provider directory and utilization data, the ratio of Medicaid patients per provider is plotted against the percentage of providers participating in the Texas Medicaid program. Payers should concentrate their network development efforts in markets where the patient-to-provider ratio is below benchmarks or regulatory requirements.
Steps to Conduct a Network Coverage Analysis
- Define Criteria for Network Coverage
In addition to considering regulatory requirements for network adequacy, determine the criteria that will define a high-performance provider network within the target market, including geographic coverage, types of specialties offered, quality metrics, cost-effectiveness and member satisfaction ratings. Consider how new technology might change workforce roles and functions.
- Analyze Internal Network Data
Review internal data to identify any obvious gaps or deficiencies with the current provider network, including geographical distribution of providers, provider performance, provider referral patterns, member utilization, member demographics and outcomes.
- Curate External Market Data
Demographic data including current-year population and five-year population projections:
- Real-time healthcare utilization and prevalence of disease incidence rates by patient ZIP Code
- Current physician supply including specialty, age, panel size and FTE breakout by practice location
- Benchmark provider-to-population ratios based on market similarity
- Geospatial Assessment
Utilize geospatial data to map and visualize provider distribution and identify geographic pockets that are underserved or lacking access for certain medical specialties. Segment market access by medical specialty and facility type.
- Identify Network Gaps
Analyze external market data to identify areas where members consistently access out-of-network providers to evaluate potential service gaps in the current network design. Quantify service gaps and areas of unmet need based on the current supply of providers compared to the expected provider demand:
- Calculate provider demand using Census population and benchmark provider-to-population ratios
- Calculate the current provider supply (total FTE count) using actual volume by site of service (% of FTE)
- Calculate patient loyalty to better understand the current share of medical services by specialty
- Develop a Strategic Plan
Prioritize market demand and network gaps based on compliance with regulatory requirements and evolving membership needs. Develop a detailed action plan to identify and recruit new providers to fill gaps in the current network.
- Monitor and Maintain Network Coverage
Continuously monitor the coverage of the provider network, adjusting as needed to ensure ongoing compliance with regulatory requirements and the evolving needs of the member population, including routine audits, provider surveys and updates to network adequacy standards.
Use Case: Managing Network Performance to Meet MLR Targets
The concept of “high-value” networks is popular for employers hoping to constrain healthcare costs, as well as with health systems hoping that payers will steer volume based on that designation. Logically, a “high-value” network would be just that – a group of providers who deliver value for money, i.e., average or better than average quality in exchange for a reimbursement rate that is near or below the median market rate.
In the absence of tangible proof of quality outcomes, health insurers often use volumes (and brand) as a proxy for “high-value” network facilities. With the advent of health plan price transparency, health plans – who have long known about wide variance in reimbursement rates – may be forced to reconsider the selection criteria for a provider to be included as a “high-value” network participant, if not the minimal quality standards for in-network designation.
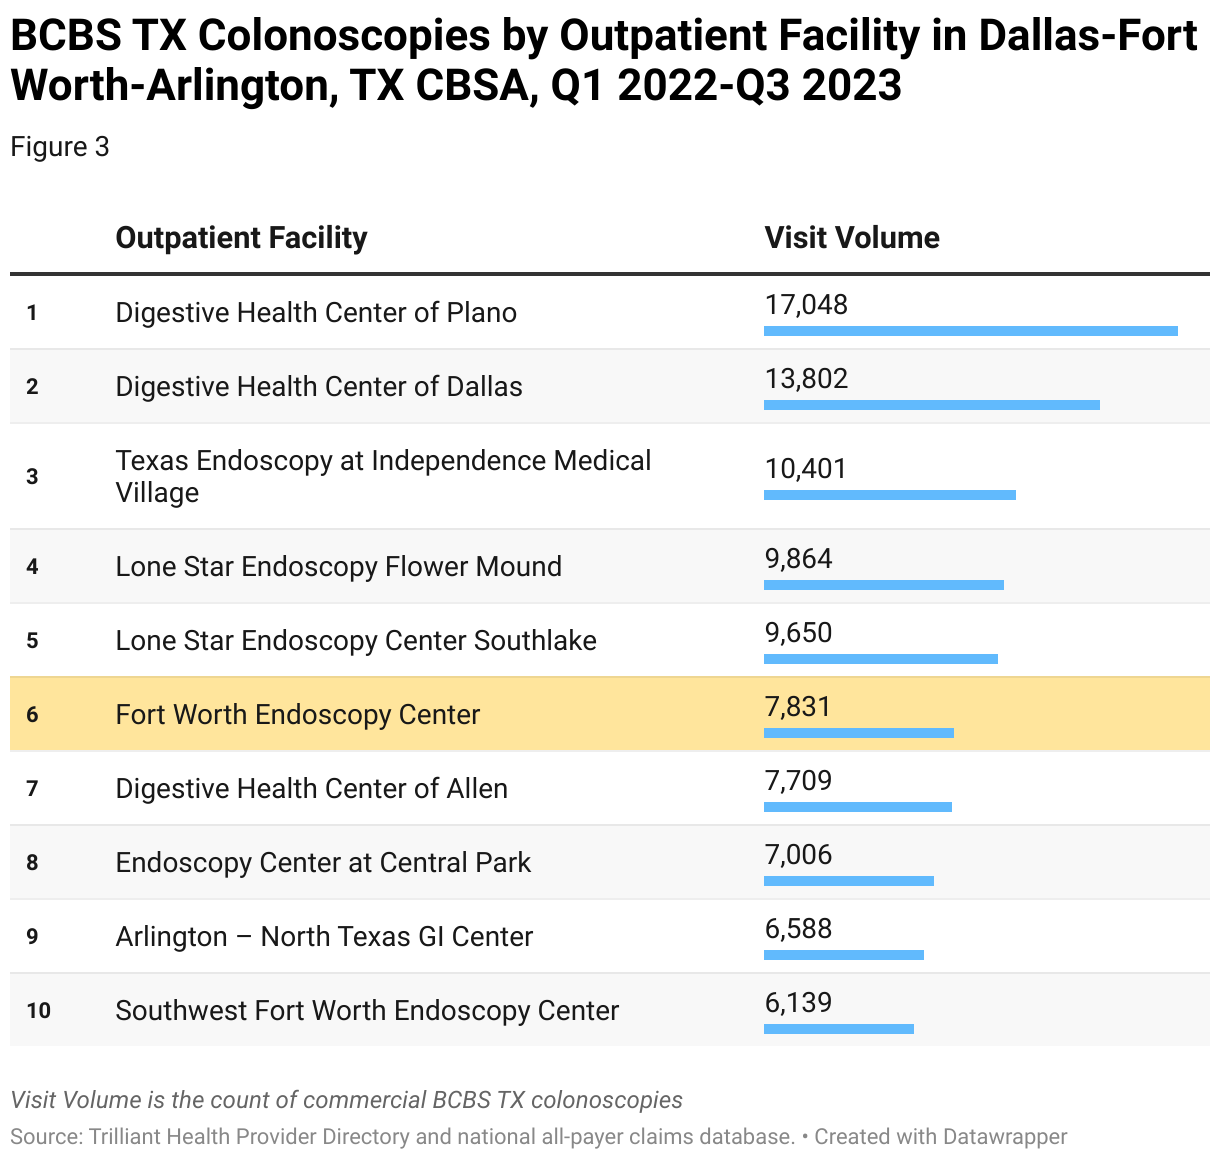
In this example, using a combination of provider directory, utilization and health plan price transparency data, Fort Worth Endoscopy Center is a high-volume provider for Blue Cross and Blue Shield of Texas (BCBS TX) in the Dallas-Fort Worth-Arlington, TX CBSA.
However, the health plan price transparency data for CPT 45380 – Colonoscopy reveals that Fort Worth Endoscopy Center offers low value for money, with an in-network reimbursement higher than almost every other in-network provider while delivering quality outcomes that are below the expected value.
Quality vs. BCBS TX Commercial Visit Volume vs. BCBS TX In-Network Negotiated Rate for CPT 45380 – Colonoscopy in Dallas-Fort Worth-Arlington, TX CBSA
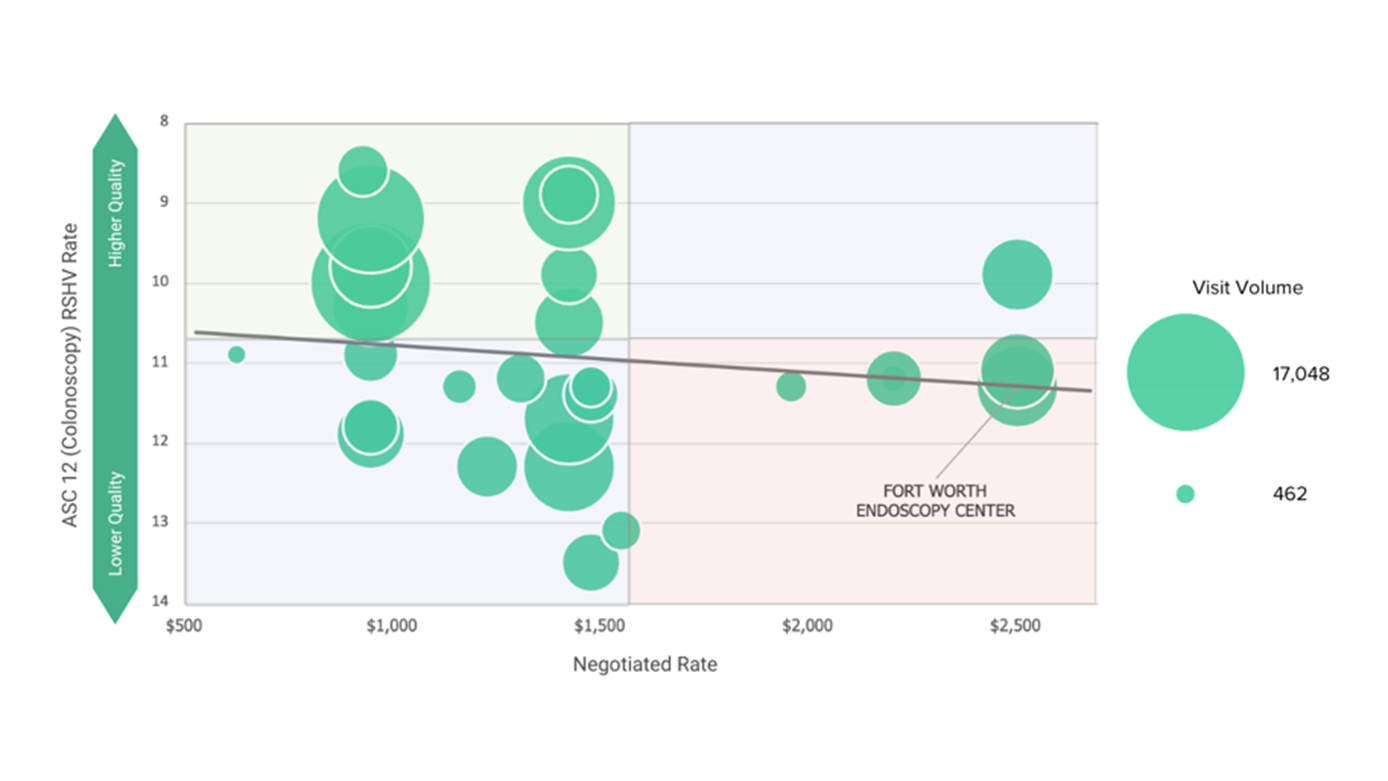
Source: Trilliant Health Provider Directory, national all-payer claims database and health plan price transparency dataset; Ambulatory Surgical Center Quality Reporting (ASCQR) program
Steps to Manage Health Plan Network Performance
- Define Network Goals and Key Performance Measures
In addition to considering regulatory requirements for network adequacy, determine success measures for overall network performance. Establish criteria for selecting high-performing providers, including factors such as volume of services provided, clinical outcomes, patient satisfaction, geographic accessibility and cost-effectiveness.
- Evaluate the Current Provider Network
Leverage internal data to evaluate the effectiveness of the current provider network in achieving defined goals and meeting the needs of the member population. Adjust to the network design based on performance data, member feedback and changes in market dynamics.
- Provider Profiling for Network Expansion
Leverage external market data to identify providers with high volume and better-than-average quality performance. Evaluate key performance indicators, such as total cost of care, complication rates, readmission rates and adherence to evidence-based guidelines. Utilize quality metrics and performance indicators to target providers based on their effectiveness in delivering high-value care.
- Engage Target Providers
Engage with high-performing providers to establish partnerships and negotiate contracts that incentivize quality and efficiency. Tie reimbursement to outcomes and performance metrics to encourage continuous improvement and accountability.
- Network Monitoring and Feedback
Regularly evaluate the effectiveness of the provider network. Establish mechanisms for monitoring performance and provide regular feedback to providers, including comparative data on key metrics, to support performance improvement efforts. Offer education and support to providers to help them improve their clinical outcomes, adopt best practices and enhance patient engagement.