Capital Allocation Strategies for Healthcare Providers
Every healthcare provider operates in an environment with high capital costs, labor costs and regulatory burden. As a general principle, the capital costs for a provider are positively correlated with the acuity of the services that a provider delivers. The higher the acuity of services, the higher the cost of PP&E associated with delivering the higher acuity services and – importantly – the higher the regulatory burden for licensure and accreditation.
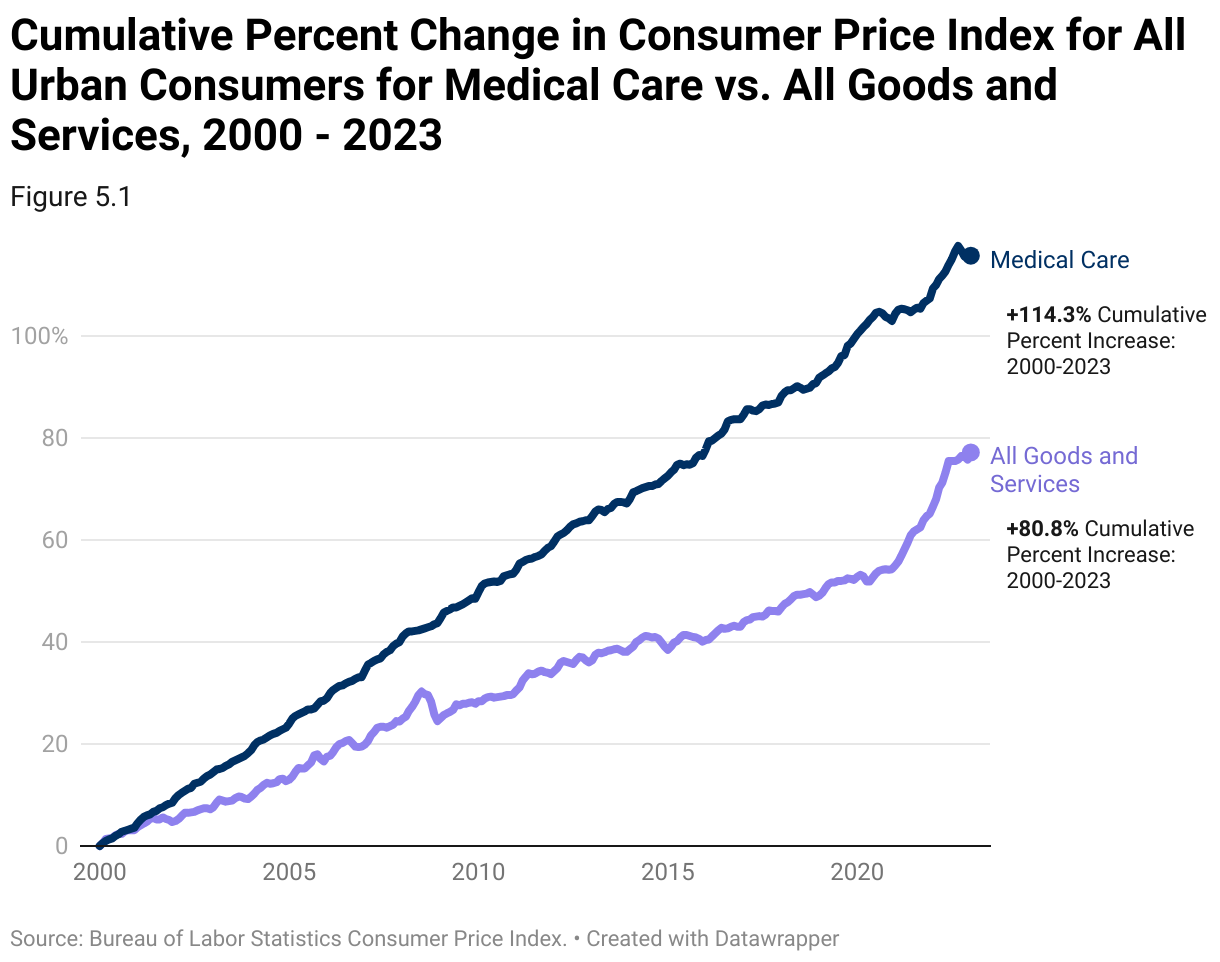
Another general principle is that government regulation increases continuously, and there is no contrary example in healthcare since the establishment of Medicare in 1965. Yet another general principle is that inflation, over the arc of decades, increases continuously, if occasionally imperceptibly, and, again, there is no contrary example in healthcare since the establishment of Medicare in 1965. In fact, prices for medical care have more than doubled since 2000.
Against the backdrop of continuous increases in the cost of labor, supplies, capital equipment, capital maintenance, construction and regulatory compliance, healthcare providers must face the sobering reality that overall demand for healthcare services – as opposed to pharmaceuticals - is relatively flat, while the percentage of Americans with commercial health insurance is declining.
The result is that return on invested capital becomes more critical every year, every month and every day. Before considering an investment of capital in a service line, piece of capital equipment, value-based care program, facility, joint venture or acquisition, provider stakeholders should have answered the applicable questions set forth previously in Chapters 1-4. Having suitably addressed issues of competitive landscape and future demand, provider stakeholders should answer the following questions:
- In how many markets does the stakeholder compete? What is the total addressable market (TAM) of each market? What is the stakeholder’s market share in each market?
- What is the comparative quality of the markets in which the stakeholder competes?
- What is the relative strength of the stakeholder’s competitors across markets? Are those competitors national, regional or local?
- What are the general and specific growth trends within each market? Are competitors entering or leaving that market?
- In which markets does the stakeholder have the most favorable combination of future demand, reimbursement rates and market share?
- What is the allocation of proposed capital projects relative to the quality of the markets to which the capital would be allocated?
- Having answered all these questions, which markets and service lines offer the best opportunity for market share expansion? Which markets or service lines should be deemphasized or abandoned?
Use Case: Investing in De Novo Growth: Eye and Ocular Services
The most important elements in de novo growth opportunities are markets with a significant unmet clinical need and favorable trends in future demand and reimbursement.
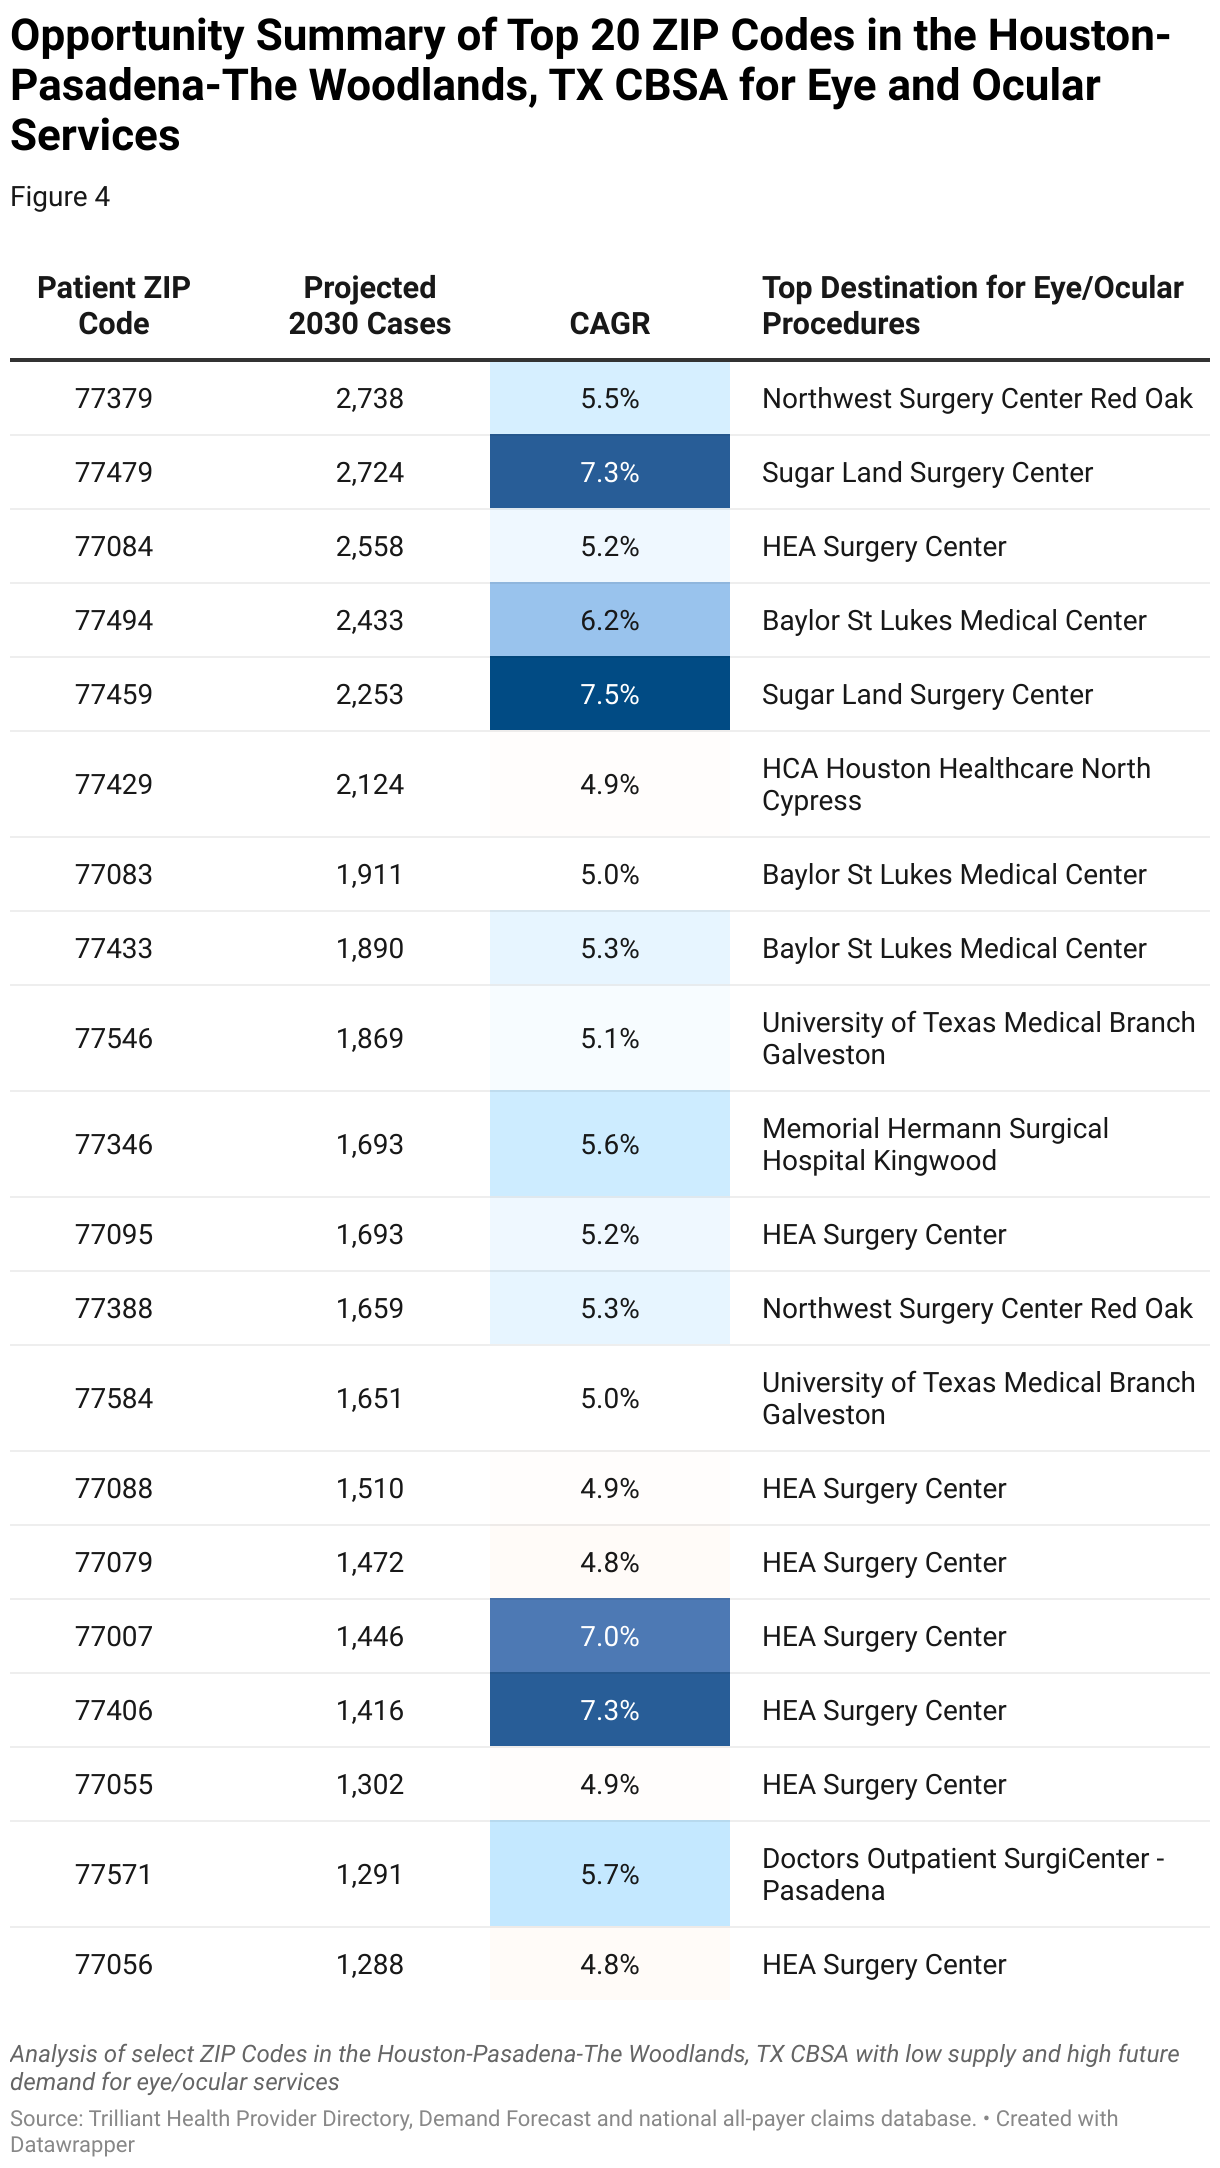
In this example, using utilization and demand forecast data, eye and ocular is one of the fastest-growing surgical service lines in the Houston-Pasadena-The Woodlands, TX CBSA (4.8% CAGR).
In the Houston-Pasadena-The Woodlands, TX CBSA, there are 41 ZIP Codes with above-market growth and a projected surgical demand that will exceed 1,000 cases in 2030. ZIP Codes with high patient demand and limited access should be viewed as “tier one” expansion opportunities.

Steps to Invest in De Novo Growth
- Internal Planning
Ensure alignment and buy-in across the organization, including feedback from senior leadership and other key stakeholders, regarding expansion priorities. Review historical performance and forecast future financial projections to assess the financial health and capacity for expansion. Determine the funding requirements for de novo growth initiatives, including capital investment, working capital and operational expenses.
- Curate External Market Data
Configure external data sources around the defined service offering. Normalize the data to align with internal service line definitions and classifications. This may involve mapping external categories or codes to internal service line categories. Determine key metrics for standard reporting and market evaluation:
- Demographic data including current-year population and five-year population projections
- Real-time healthcare utilization and prevalence of disease incidence rates by patient ZIP Code
- Current provider supply including service mix, procedure volume and FTE breakout by location
- Future market demand by service line and procedure
- Market Research and Analysis
Conduct thorough market research to identify markets and sub-markets with the greatest upside potential for new market growth. Analyze market trends, including population growth, aging demographics, prevalence of disease and future market demand. Evaluate insurance coverage and payer-specific reimbursement rates for target services.
- Assess Competitive Landscape
Identify existing practice locations, clinics, surgery centers and hospitals in the target area. For each competitive offering, evaluate the service mix, pricing strategy, market penetration and community reputation. Highlight areas where current and projected patient demand exceeds the current supply of providers in the market.
- Prioritize Market Opportunity
Identify and prioritize markets with growing populations, high demand for target services, favorable reimbursement rates and fewer competitors. At a local level, consider geographic factors, such as proximity to existing facilities, transportation accessibility and market saturation.
- Financial and Operational Assessment
Conduct financial feasibility studies to assess the potential return on investment (ROI) and profitability of target market opportunities. Forecast revenue potential based on projected patient volume, service mix and market-specific reimbursement rates. Estimate the initial investment required for the development of a new practice location, including costs for facility construction or renovation, equipment purchases, staffing and marketing.
- Build Market Entry Plan
Develop a comprehensive implementation plan with clear timelines, milestones and responsibilities for executing de novo growth initiatives. Continuously evaluate performance metrics, patient feedback and market trends to identify opportunities for optimization and refinement. Adjust strategies and tactics based on real-time data, feedback and changing business conditions to ensure ongoing alignment with patient needs and preferences.
Use Case: Investing in Primary Care for Top-of-Funnel Growth
Historically, hospitals have focused on developing comprehensive primary care networks as the “top of the funnel” for profitable service line growth, even though primary care is itself usually a “loss leader.”
In this example, using provider directory, utilization and consumer data, 39.8% of the “high-margin” encounters in the market originated with a primary care visit, as compared to 29.6% of the target health system’s “high-margin” encounters.
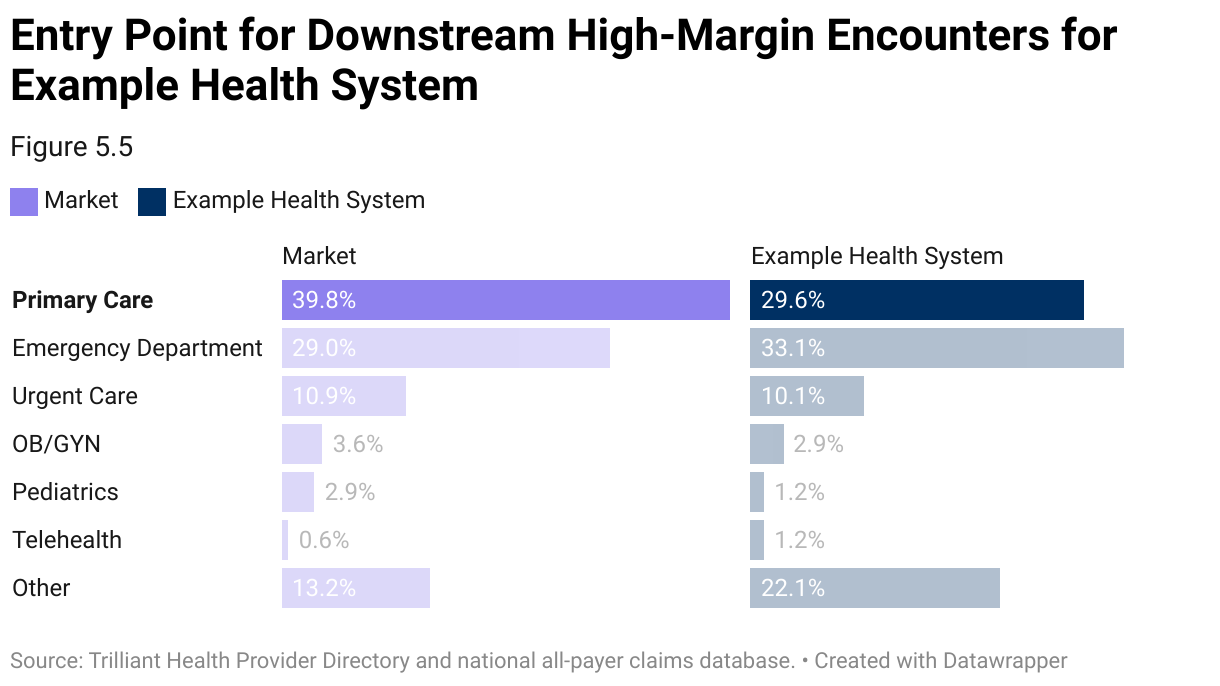
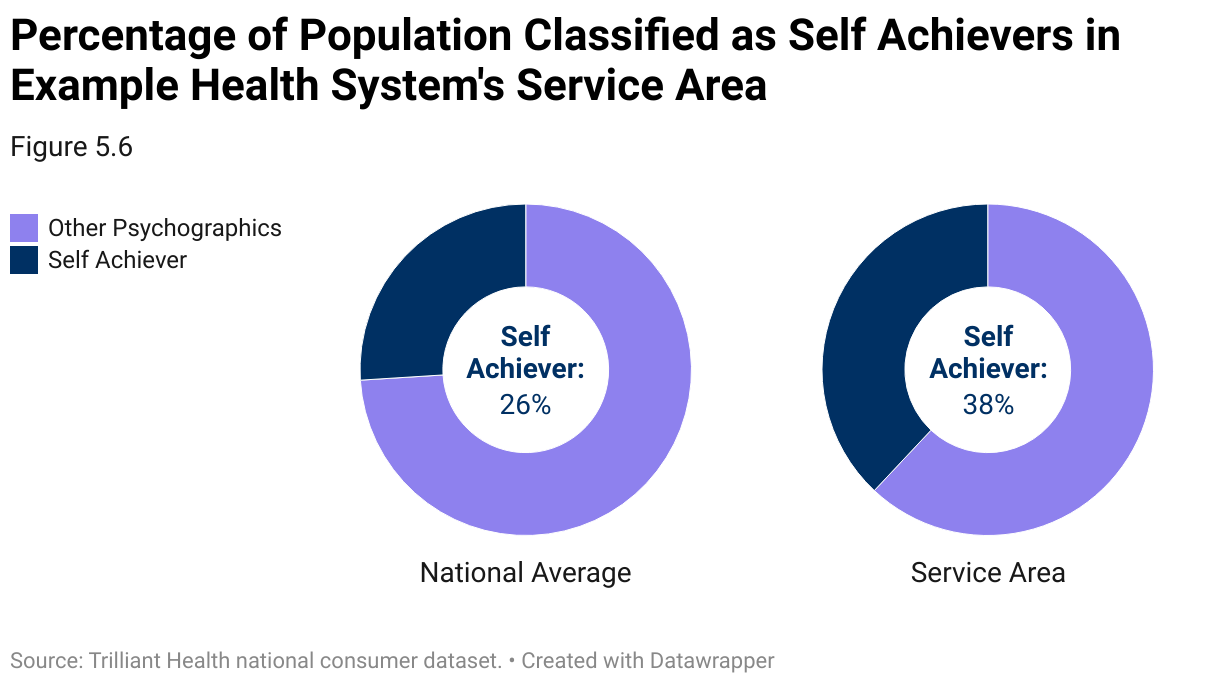
Because 38% of the population in the market has the “Self Achiever” psychographic profile, which is inclined to utilize traditional primary care services, the example health system should invest in expanding access to primary care services through de novo growth and/or increased alignment with independent primary care groups.
Use Case: Investing in Urgent Care for Top-of-Funnel Growth
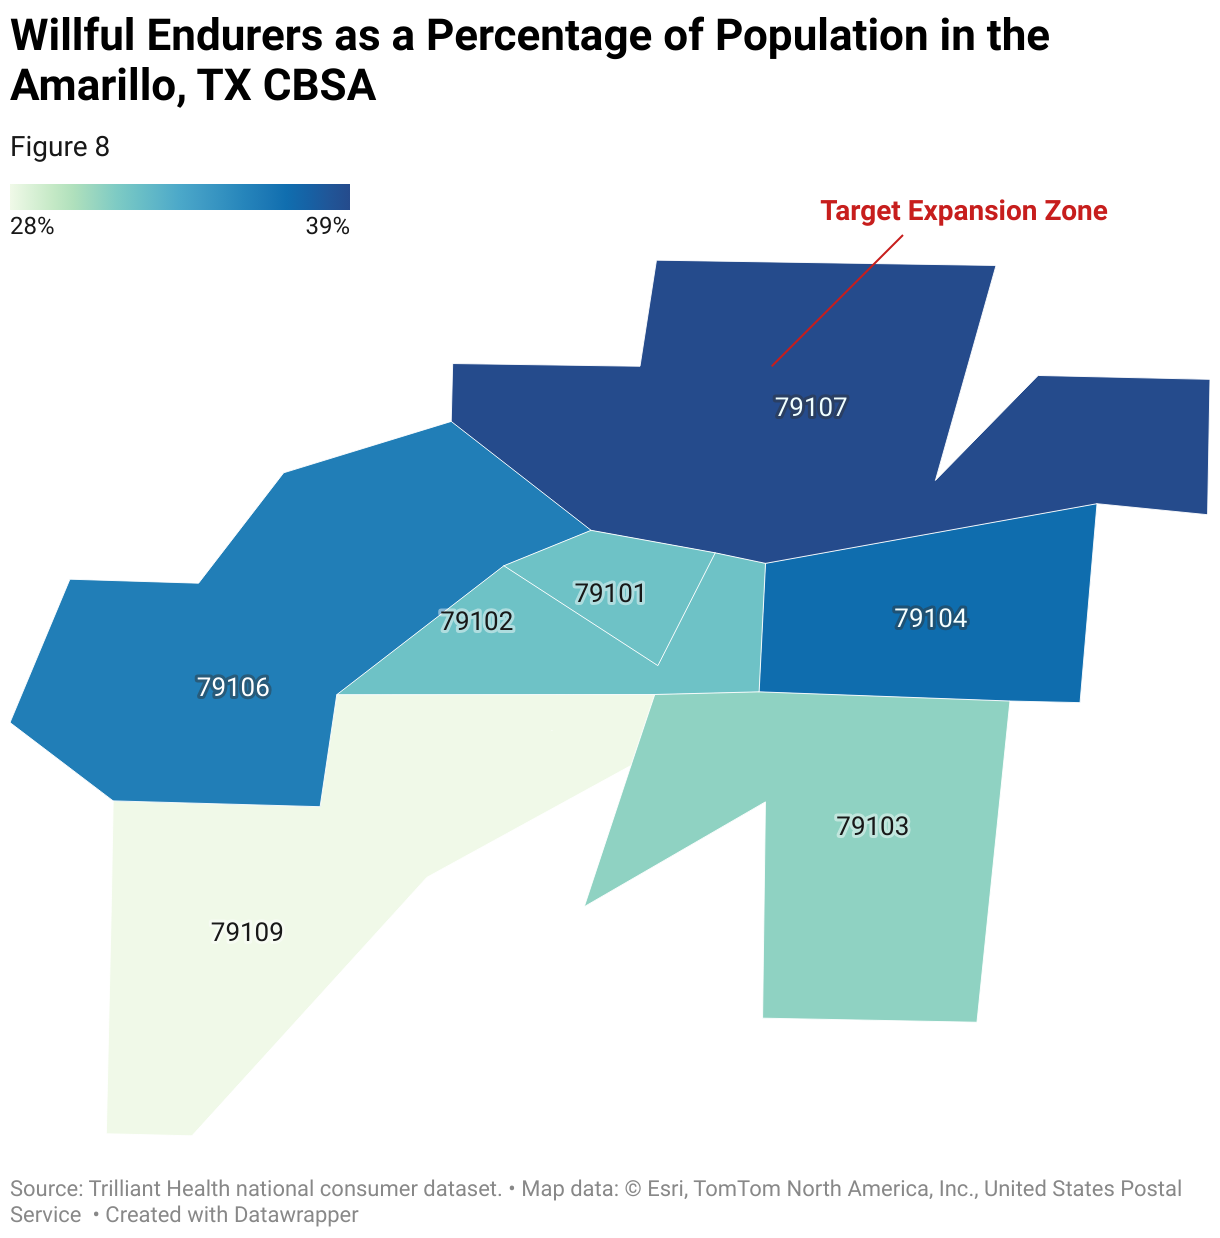
Consumers with a “Willful Endurer” psychographic profile are more inclined to utilize urgent care or other retail-based clinics than traditional primary care physician clinics.
In this example, using provider directory, utilization and consumer data, the highlighted ZIP Code has unmet demand for urgent care clinics, with patients travelling >15 minutes for urgent care services.
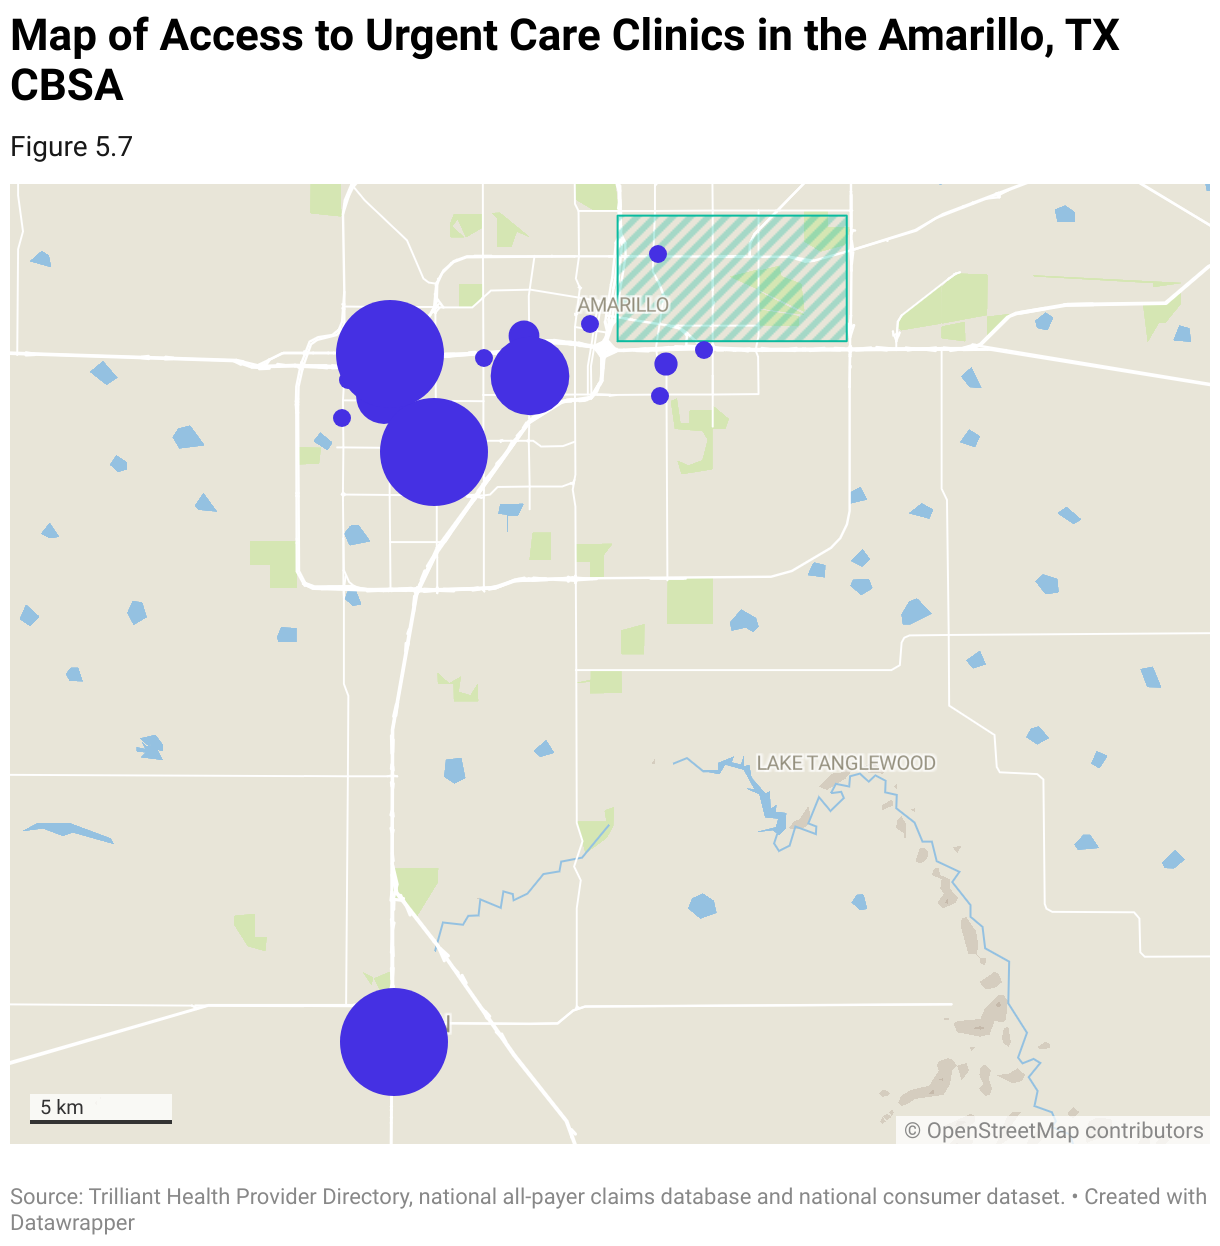
Urgent Care Demand in Target Expansion Zone:
The only urgent care clinic in the target expansion zone, Northwest Texas Healthcare Urgent Care, is not aligned with the example health system, with only 7% of the urgent care’s patients receiving care from the example health system.
Additionally, the target area has the highest Willful Endurer population in the market. The Willful Endurer psychographic profile is 7X more likely to consume urgent care and emergency department services as compared to other psychographic profiles, making this ZIP Code a strategic target for urgent care services.
Steps to Invest in Top-of-Funnel Growth
- Evaluate Network Design
Leverage internal data to assess the effectiveness of the current network for “top-of-the-funnel” services (primary care, urgent care, telehealth or emergency department). Analyze utilization patterns to understand the geographic distribution of patients and utilization rates for each entry point. Evaluate the geographic footprint of the network and identify pockets that are underserved or lacking access. Solicit patient feedback through surveys to assess overall satisfaction with the current access mix and quality of care. Identify areas for improvement and prioritize initiatives to expand “top-of-the-funnel” access within the network.
- Curate External Market Data
Gather comprehensive market data on patient demographics, utilization patterns and access for primary care, urgent care, telehealth and ED services. Configure external data sources around the defined service offering. Normalize the data to align with internal service line definitions and classifications.
- Patient Journey Mapping
Leverage external market data to map out the patient journey across various entry points, including primary care, urgent care, telehealth and ED services. Identify key touchpoints, decision-making factors and barriers to care at each stage of the patient journey. Analyze patient pathways to understand the factors influencing the choice of entry point, such as acuity of symptoms, convenience, accessibility, insurance coverage and provider availability.
- Market Segmentation
Utilize psychographic segmentation to better understand the clinical characteristics, care needs and utilization behaviors of the community at the ZIP Code level. Analyze utilization patterns within each patient segment to identify preferences, trends and variations in entry point selection. Identify patient groups that have high utilization tied to specific entry points.
- Geospatial Assessment
Utilize geospatial data to map and visualize access distribution and identify geographic pockets that are underserved or lacking access for certain entry points. Segment the market by facility type and system ownership.
- Benchmarking and Comparative Analysis
Benchmark current network performance and utilization against industry standards and competitors in the market. Compare entry point utilization rates, wait times and clinical outcomes across primary care, urgent care, telehealth and ED services. Identify opportunities to enhance the attractiveness and effectiveness of the current network of access points.
- Strategic Planning and Network Expansion
Develop a strategic plan for expanding access based on insights gained from the competitive analysis. Prioritize expansion efforts around markets and submarkets with high demand and limited access to care. Consider establishing new partnerships with community providers to create a wider funnel of care that will increase the downstream capture of high-margin services. Continuously evaluate performance metrics, patient feedback and market trends to identify opportunities for optimization and refinement. Adjust strategies and tactics based on real-time data, feedback and changing business conditions to ensure ongoing alignment with patient needs and preferences.
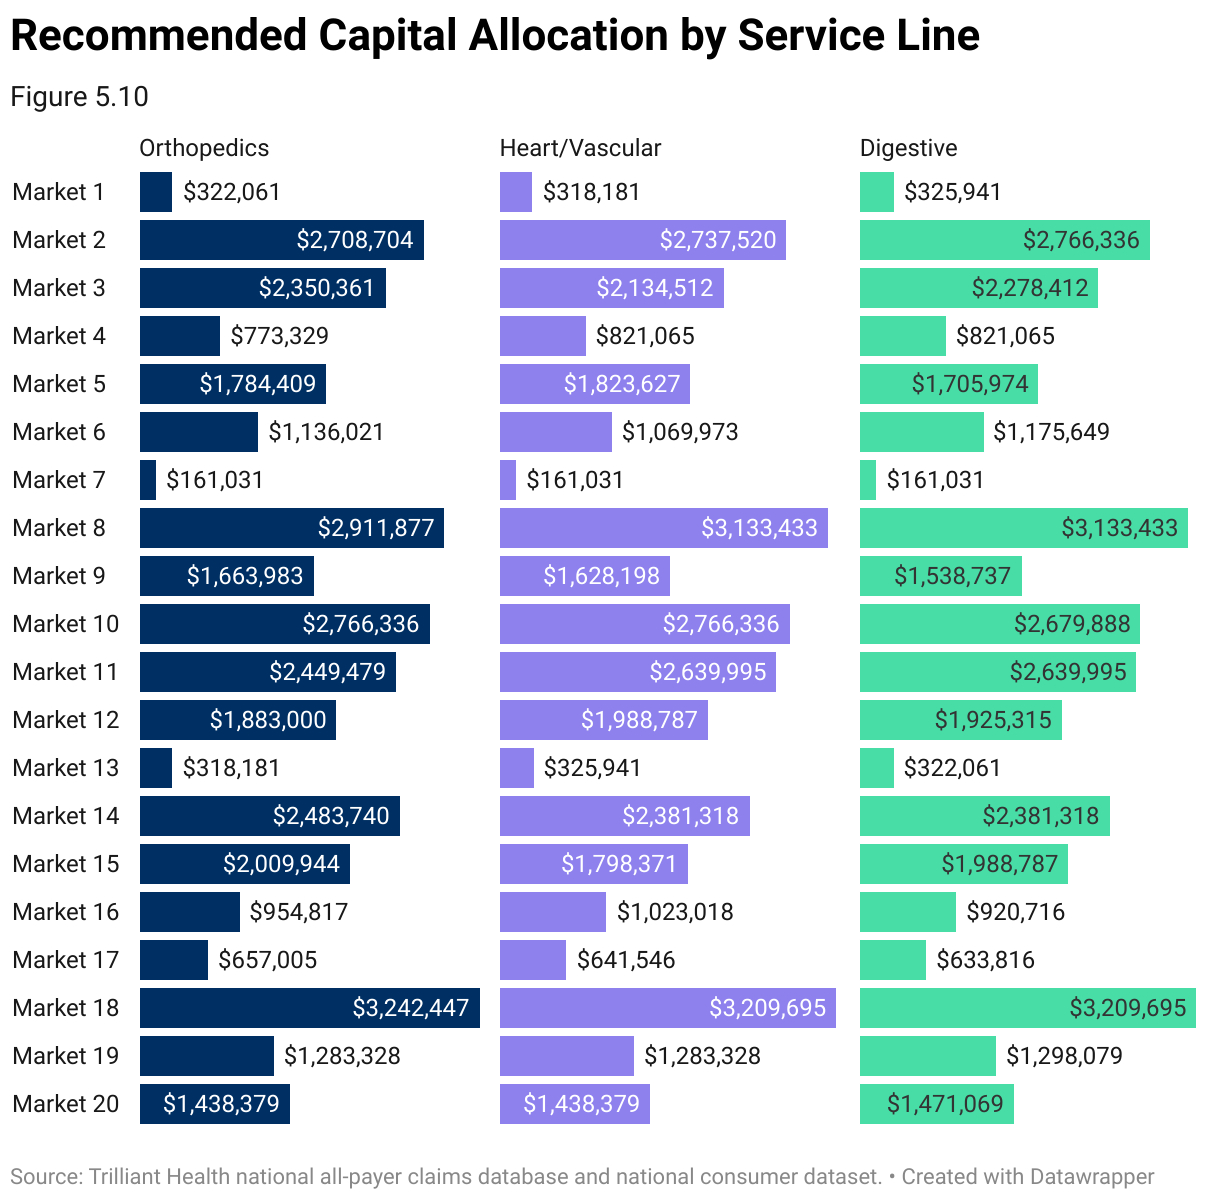
Use Case: Analyzing Capital Allocation Across Markets and Service Lines
Some healthcare providers are fortunate enough to have more compelling expansion opportunities than capital to invest. Ascertaining the best opportunities is essential to maximize return on invested capital.
In this example, using provider directory, utilization and demand forecast data, 20 markets are analyzed across three service lines to recommend capital allocation for the example health system.
Assumptions:
- $100M total budgeted capital
- All capital allocated to one of the three service lines (Orthopedic, Cardiology, Digestive)
- Health system’s calculation of expected contribution margin
First, the markets are compared across multiple service lines to rank markets evaluating current supply, future demand and current patient outmigration. Based on this market ranking, the model recommends the capital to be allocated across each market and across the three service lines.

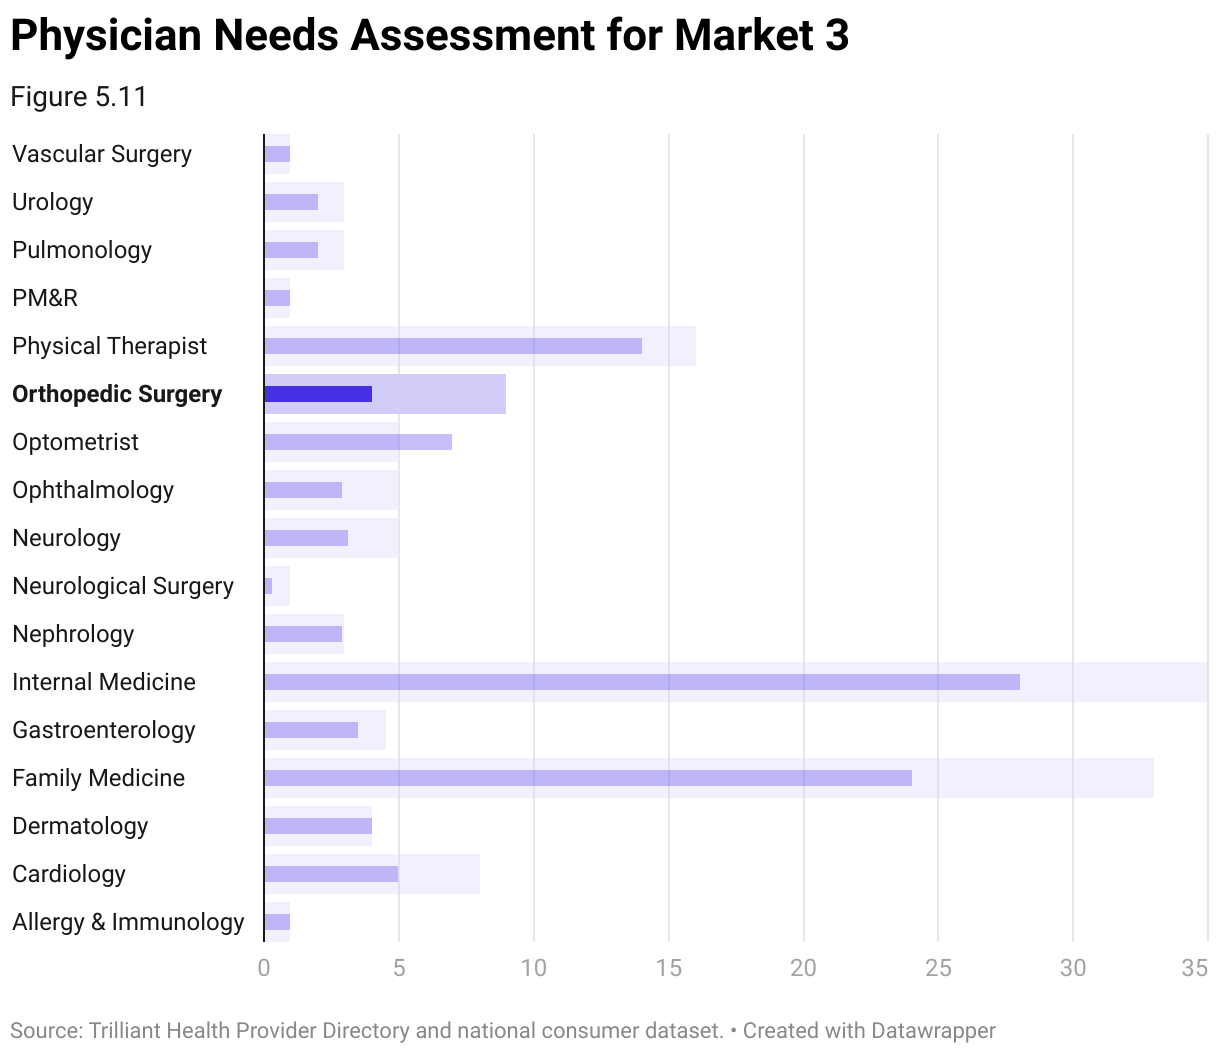
To allocate capital within each market, stakeholders can identify opportunities and threats at the market level, using the strategies discussed in previous chapters. In this example, using provider directory and utilization data, a physician needs assessment of Market 3 reveals a shortage of orthopedic surgeons. To address the shortage, the organization may consider investing a portion of the $6.8M for Market 3 to recruit additional surgeons.
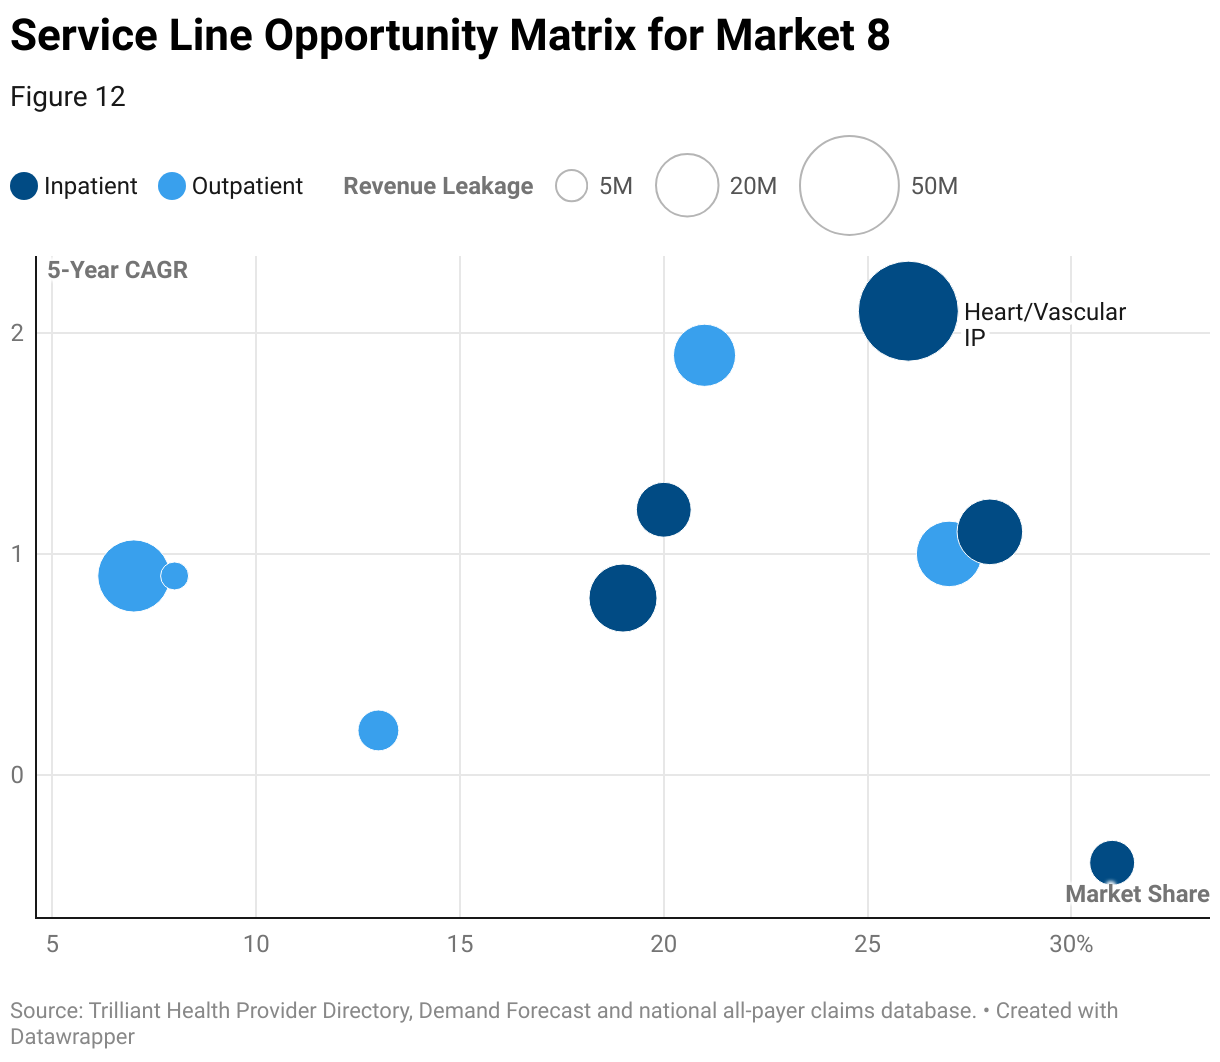
In this example, a service line opportunity matrix, which was introduced in Chapter 3, compares the five-year CAGR, revenue leakage and market share for inpatient and outpatient services across each service line, revealing significant opportunity in inpatient heart/vascular.
Steps to Allocate Capital Across Markets and Service Lines
- Internal Planning
Collect internal information from each department to understand the contribution that each service line makes to the financial health of the system. Review historical performance and forecast future financial projections to assess the financial health and capacity for future service line investment. Determine the funding requirements for service line growth initiatives, including capital investment, working capital and operational expenses.
- Curate External Market Data
Gather comprehensive market data such as service line utilization, market share, payer mix, consumer preferences and future market demand. Normalize the data to align with internal service line definitions and classifications. This may involve mapping external categories or codes to internal service line categories.
- Market Analysis and Demand Forecasting
Conduct comprehensive market research for each service area. Utilize demographic data, population health statistics, patient utilization patterns and market trends to identify areas of high demand for each service line. Forecast future demand for services based on population growth, aging trends and prevalence of diseases.
- Provider Needs Assessment
Analyze current population, healthcare utilization and provider-to-population ratios within service area to identify the provider demand for each medical specialty. Identify service gaps and areas of unmet need based on the current supply of providers compared to the expected provider demand.
- Evaluate Network Performance
Track and monitor the longitudinal journey of each patient to identify gaps in the employed provider network and quantify the amount of patient outmigration across key services. This may involve calculating overall patient retention rates as well as leakage rates by service line. Analyze the collected data to calculate key performance metrics related to competing hospital-owned medical groups that are similar in size and specialty mix. Compare medical group performance metrics against competing networks. Quantify and analyze the differences and similarities in network integrity measures such as patient retention rates and leakage by service line. Identify areas where network performance excels and areas for improvement compared to the competing networks.
- Prioritize Market Opportunity
Evaluate service line strengths and weaknesses of the system as well as external opportunities and threats within each market. Prioritize market opportunities based on factors such as service line demand, growth potential, competitive positioning, alignment with organizational goals and feasibility of implementation. Consider the strategic fit of each service line relative to the larger strategic plan. Use predictive analytics and modeling techniques to estimate the potential ROI of capital investments in different service lines and geographic areas.
- Implementation Planning
Allocate resources in alignment with strategic priorities, ensuring that investments are directed toward initiatives that drive the greatest value and impact. Develop a detailed implementation plan for each market opportunity, outlining specific goals, timelines, resource requirements and performance metrics. Recognize that market dynamics are constantly evolving, and capital allocation decisions should be revisited periodically to reflect changing circumstances and new opportunities. Regularly reassess market dynamics, competitive landscape and emerging trends to adapt the strategy as needed.
Use Case: Capital Allocation for M&A
The purpose of every M&A transaction is to acquire market share. No form of capital allocation in the health economy is riskier than M&A in healthcare services because of two unassailable truths:
- “Broken” hospitals are the only hospitals ever for sale.
- No physician ever worked harder for a health system or private equity firm than he/she did as an independent physician.
Moreover, almost every healthcare services M&A transaction is plagued by flawed assumptions and projections about:
- The financial and operational performance of the target’s business leading up to the announcement of a transaction;
- The performance of the target between the announcement and the consummation of the proposed transaction; and
- The target’s post-closing financial and operational performance.
The least predictable, and therefore most dangerous, are flawed projections about the performance of the target between the announcement and the consummation of the transaction, which is influenced by these factors:
- The inevitable decline in performance of the target which results from uncertainty among physicians, employees and patients about how the transaction will affect them;
- The inevitable regulatory obstacles that delay the consummation of a transaction, which reinforces the concerns of physicians, employees and patients; and
- The speed with which physicians will alter longstanding referral patterns after the proposed transaction is announced.
The target in a healthcare services M&A transaction ALWAYS loses market share between the announcement and consummation of a transaction, which means that M&A announcements always affect multiple health economy stakeholders. Physicians refer patients to other providers, and those providers have different reimbursement rates with payers and often have different purchasing relationships with medical device manufacturers and life sciences firms. As a result, every announced M&A transaction should spur every health economy stakeholder – especially employers - in the target’s market to consider the potential market share changes that will inevitably result.
In March 2021, Optum Care announced the acquisition of Atrius Health, which the Massachusetts AG and Supreme Court approved in April 2022. Similarly, in March 2024, Optum Care announced a tentative deal to acquire Stewardship Health, d/b/a Steward Medical Group (SMG), the physician network of Steward Health Care — a transaction that was withdrawn amid antitrust review and Steward Health Care’s subsequent Chapter 11 bankruptcy.1,2
Using provider directory and utilization data, we compared the historical referral patterns of SMG’s Massachusetts network with the referral patterns of Atrius Health’s network prior to the announcement of its proposed sale to Optum Care, during the regulatory review period and after the consummation of the transaction.
This SMG analysis was published in April 2024, before the deal’s collapse and Steward Health Care’s bankruptcy, yet it showed referral pattern shifts already underway. Both cases demonstrate that physician referral behavior is affected by M&A signals well before any deal closes or fails to close.
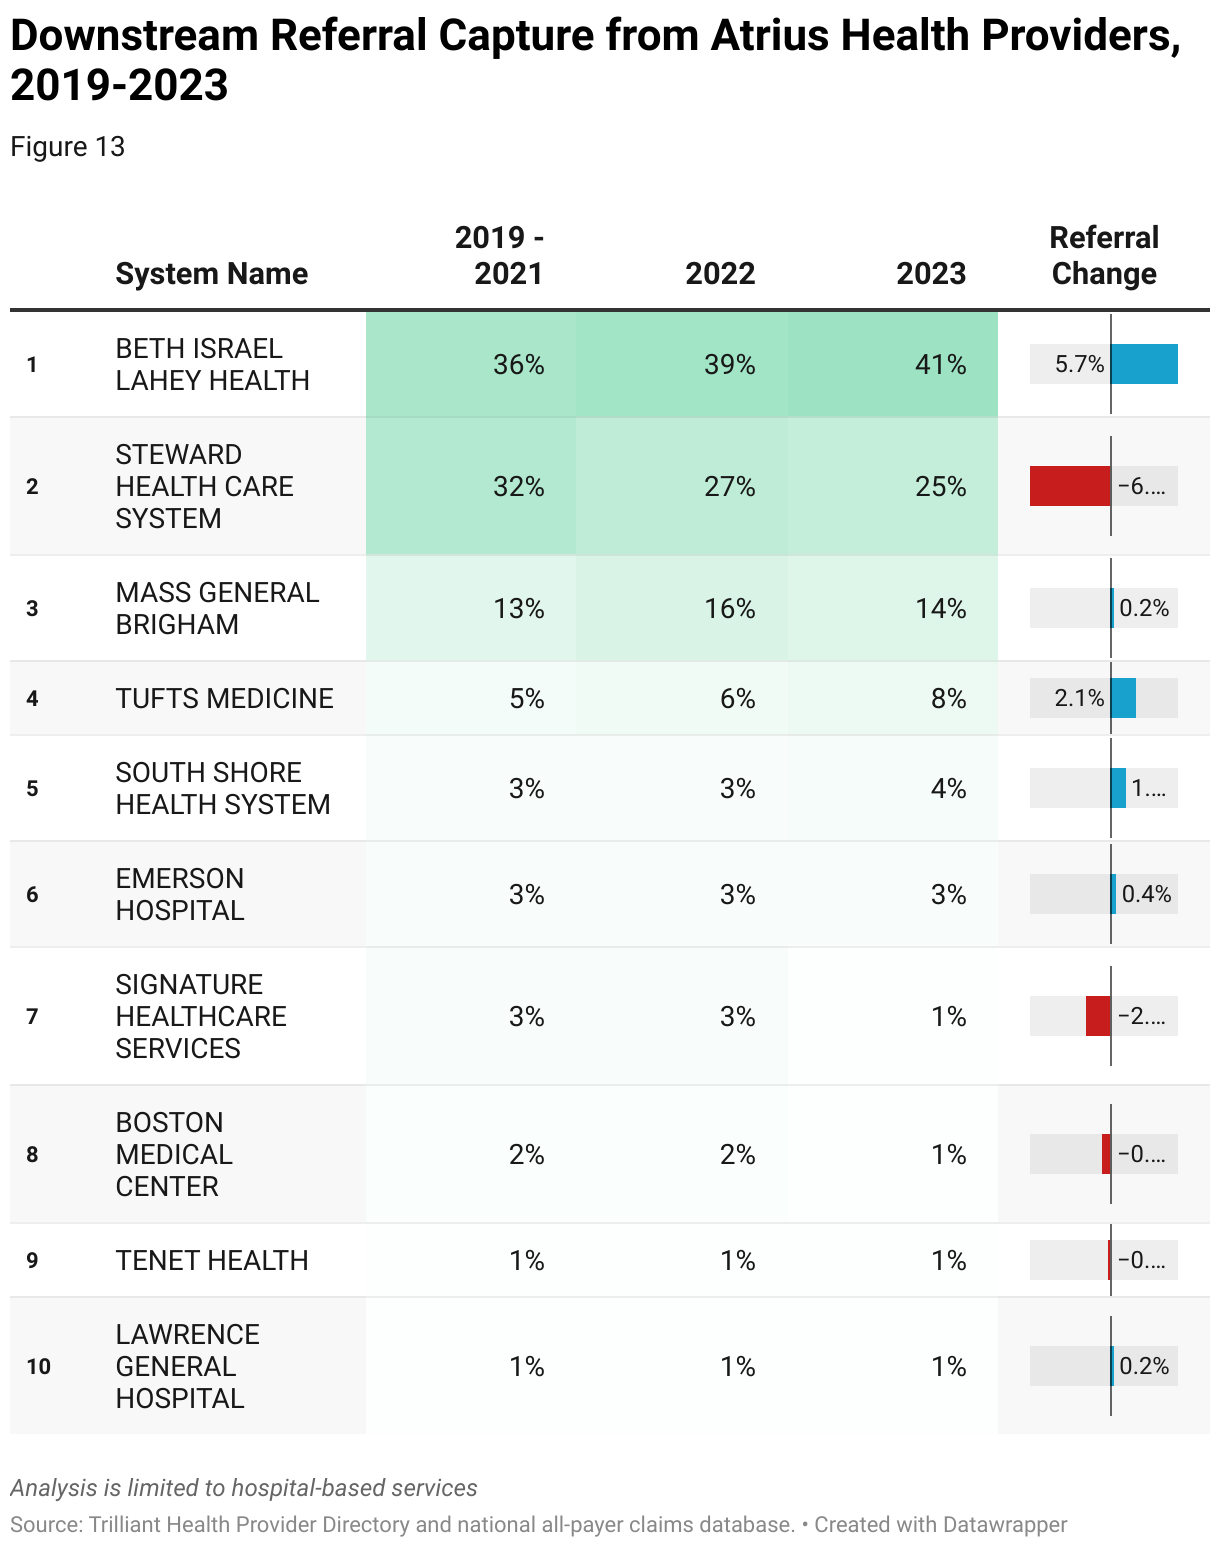
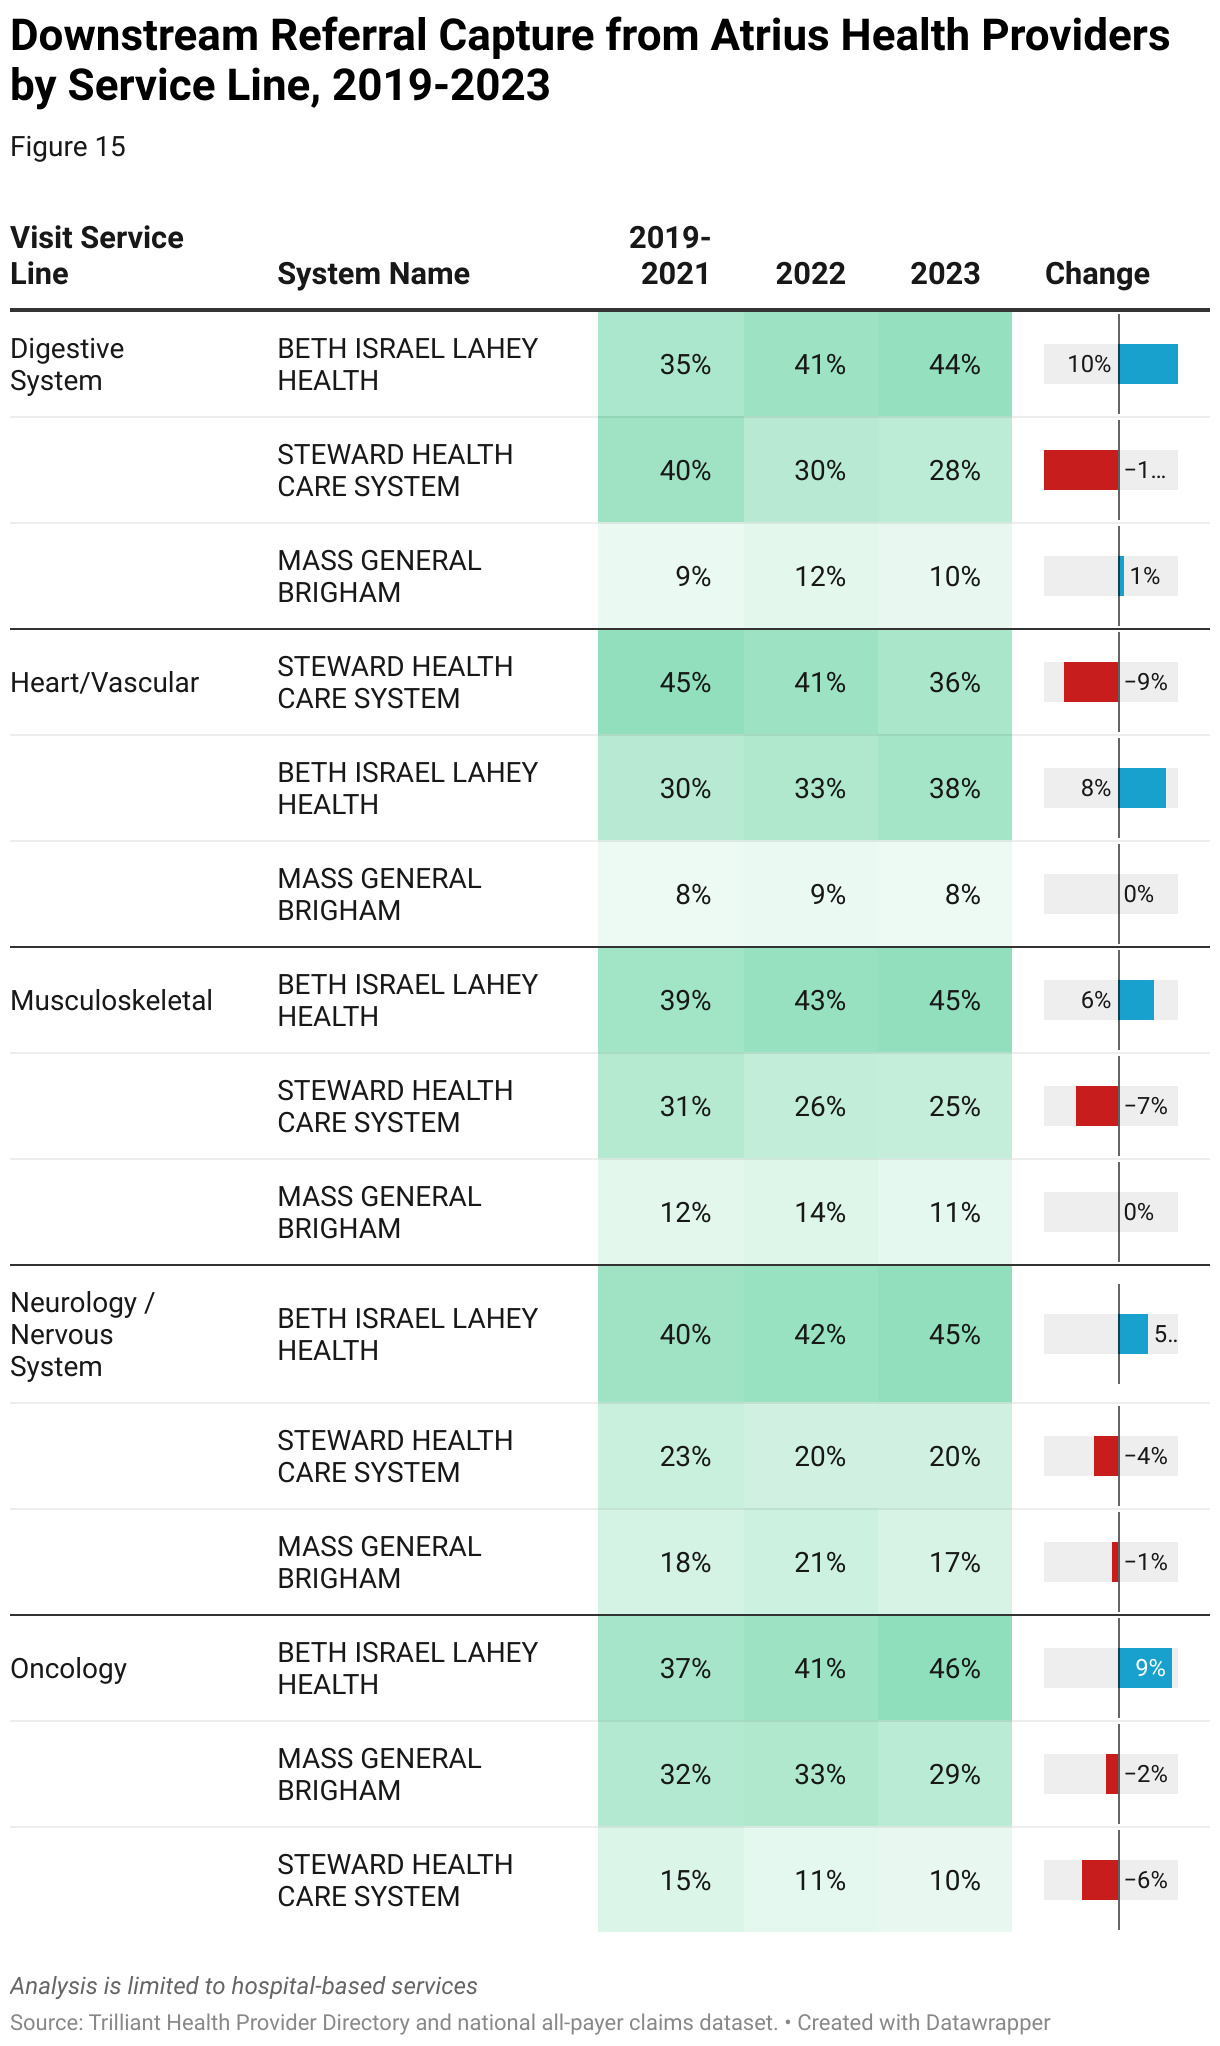
Because there is rarely a consistent pattern when physicians change referral patterns, analyzing changes in market share at the service line level is essential to understand the implications of a proposed M&A transaction. In the following example, the change in referral patterns by Atrius Health physicians to Steward Health, Beth Israel Lahey Health and Mass General Brigham are shown for select services lines for the periods prior to, during and after Optum Care’s acquisition of Atrius Health.
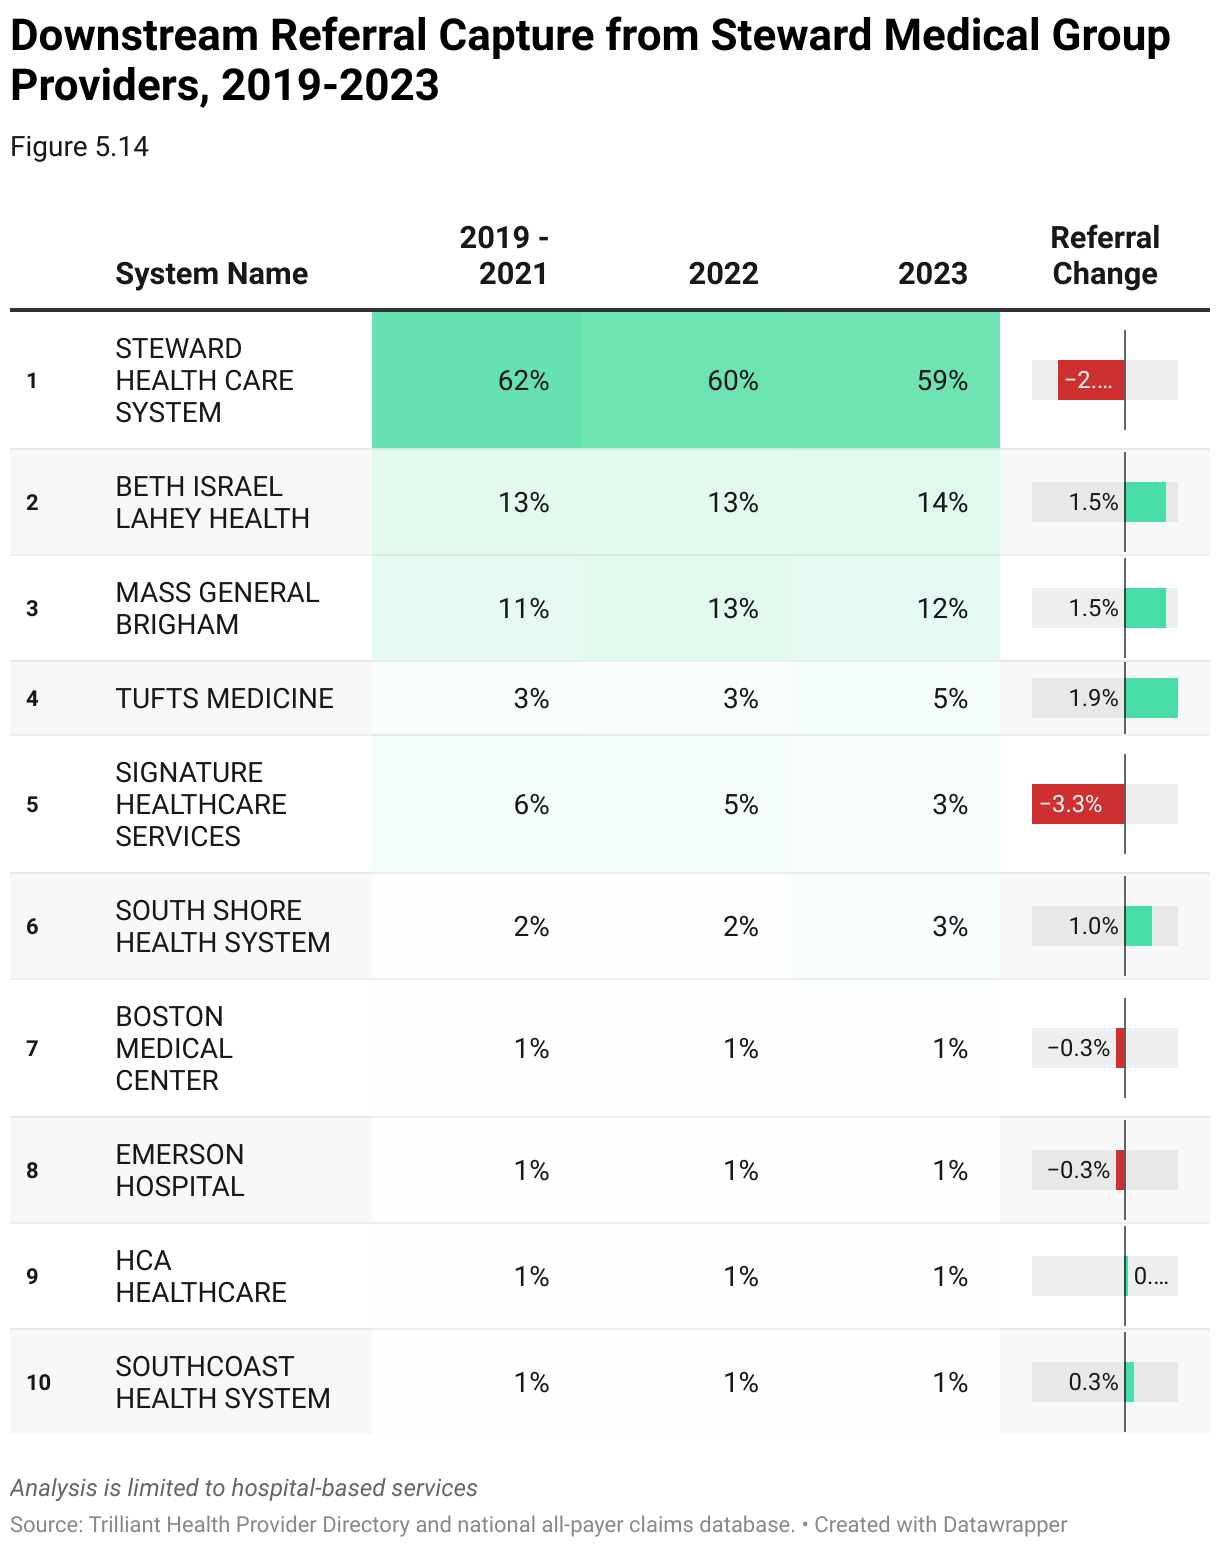
Similarly, in the following example, the change in referral patterns by SMG physicians to Steward Health, Beth Israel Lahey Health and Mass General Brigham are shown for select services lines between 2021 and 2023, revealing that SMG physicians began changing referral patterns prior to the 2024 announcement of the proposed sale to Optum Care.
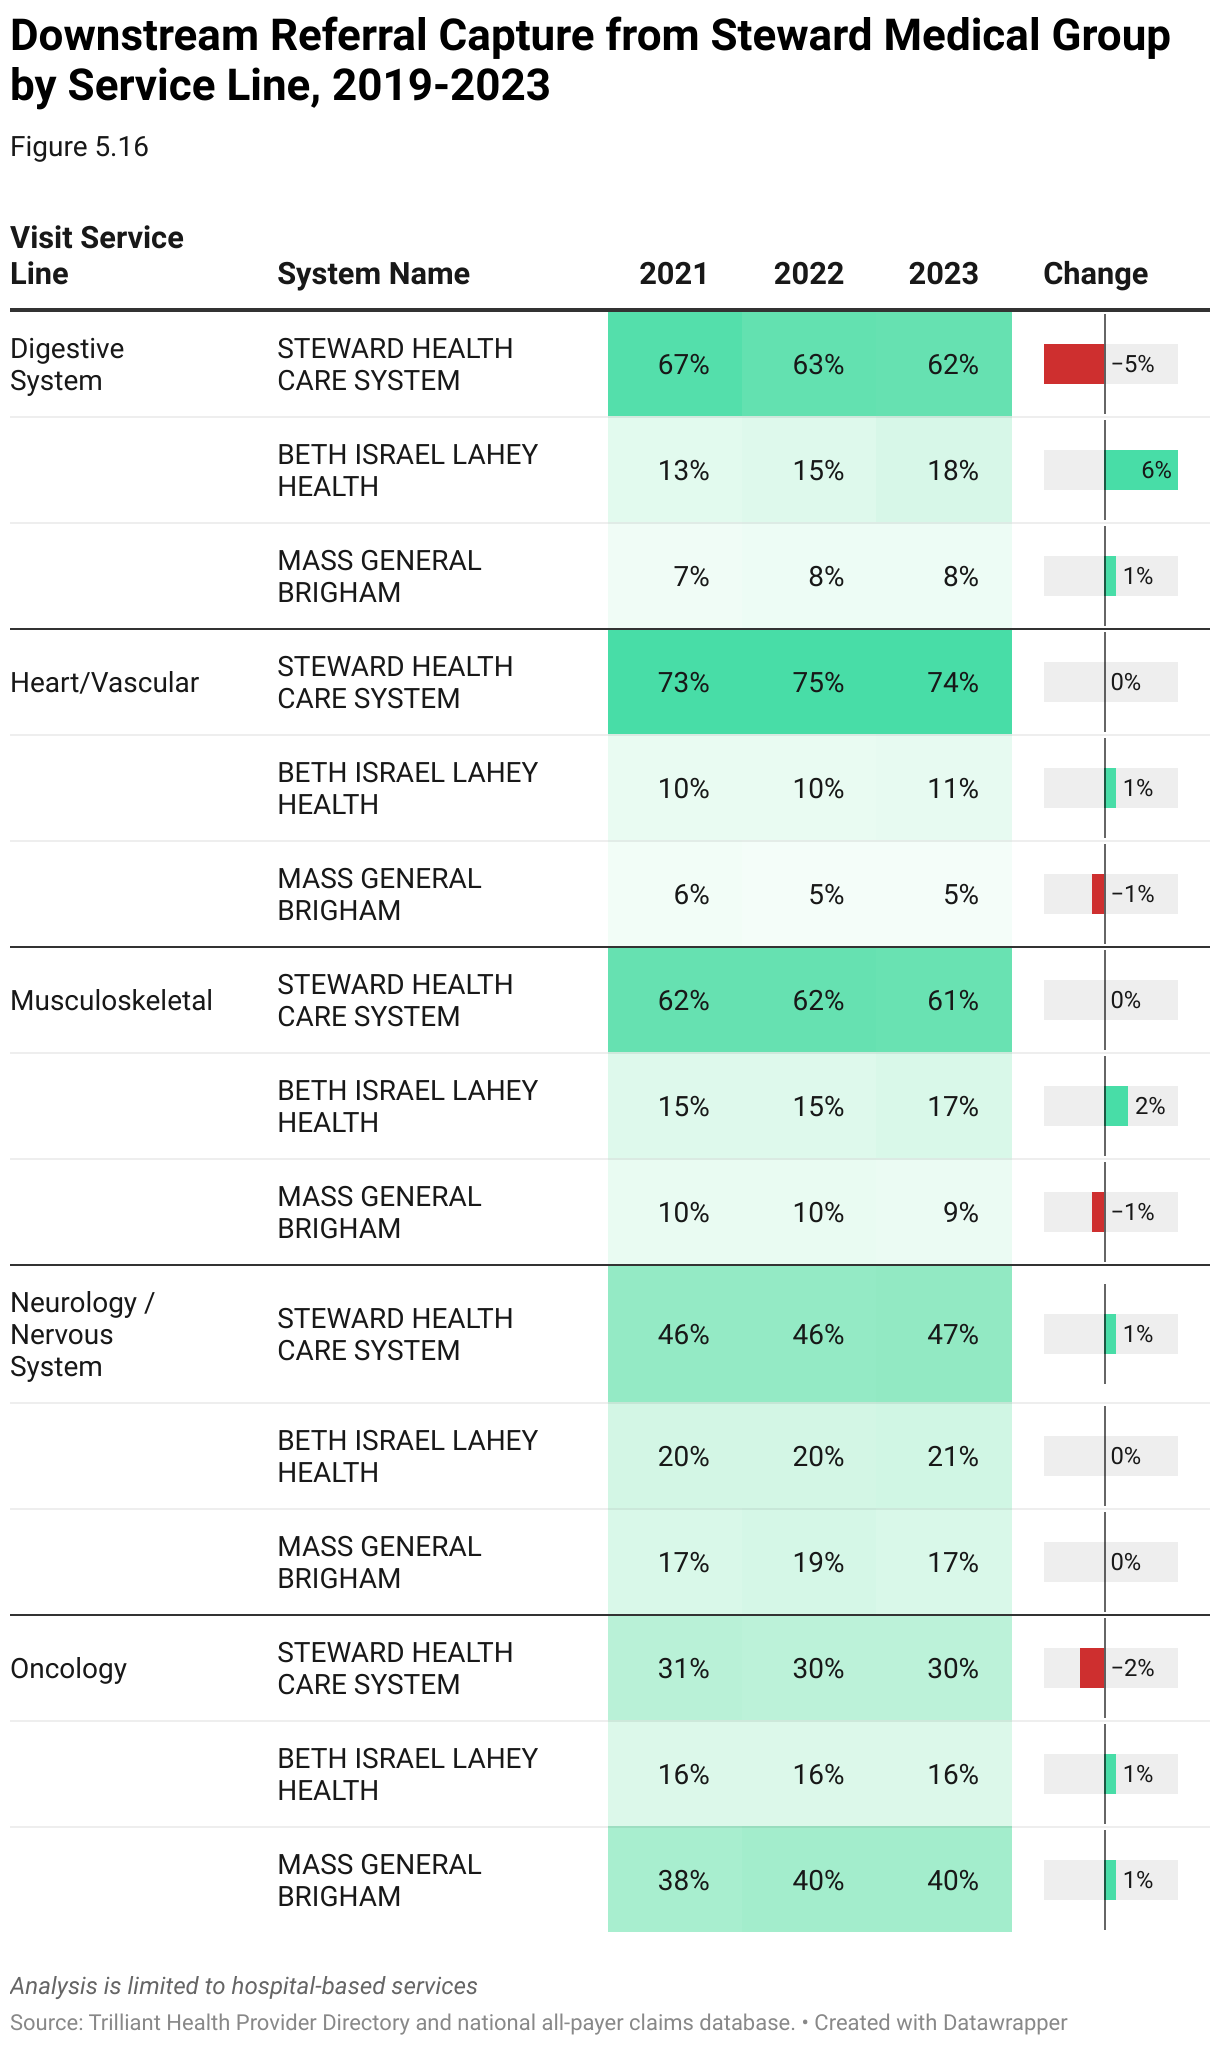
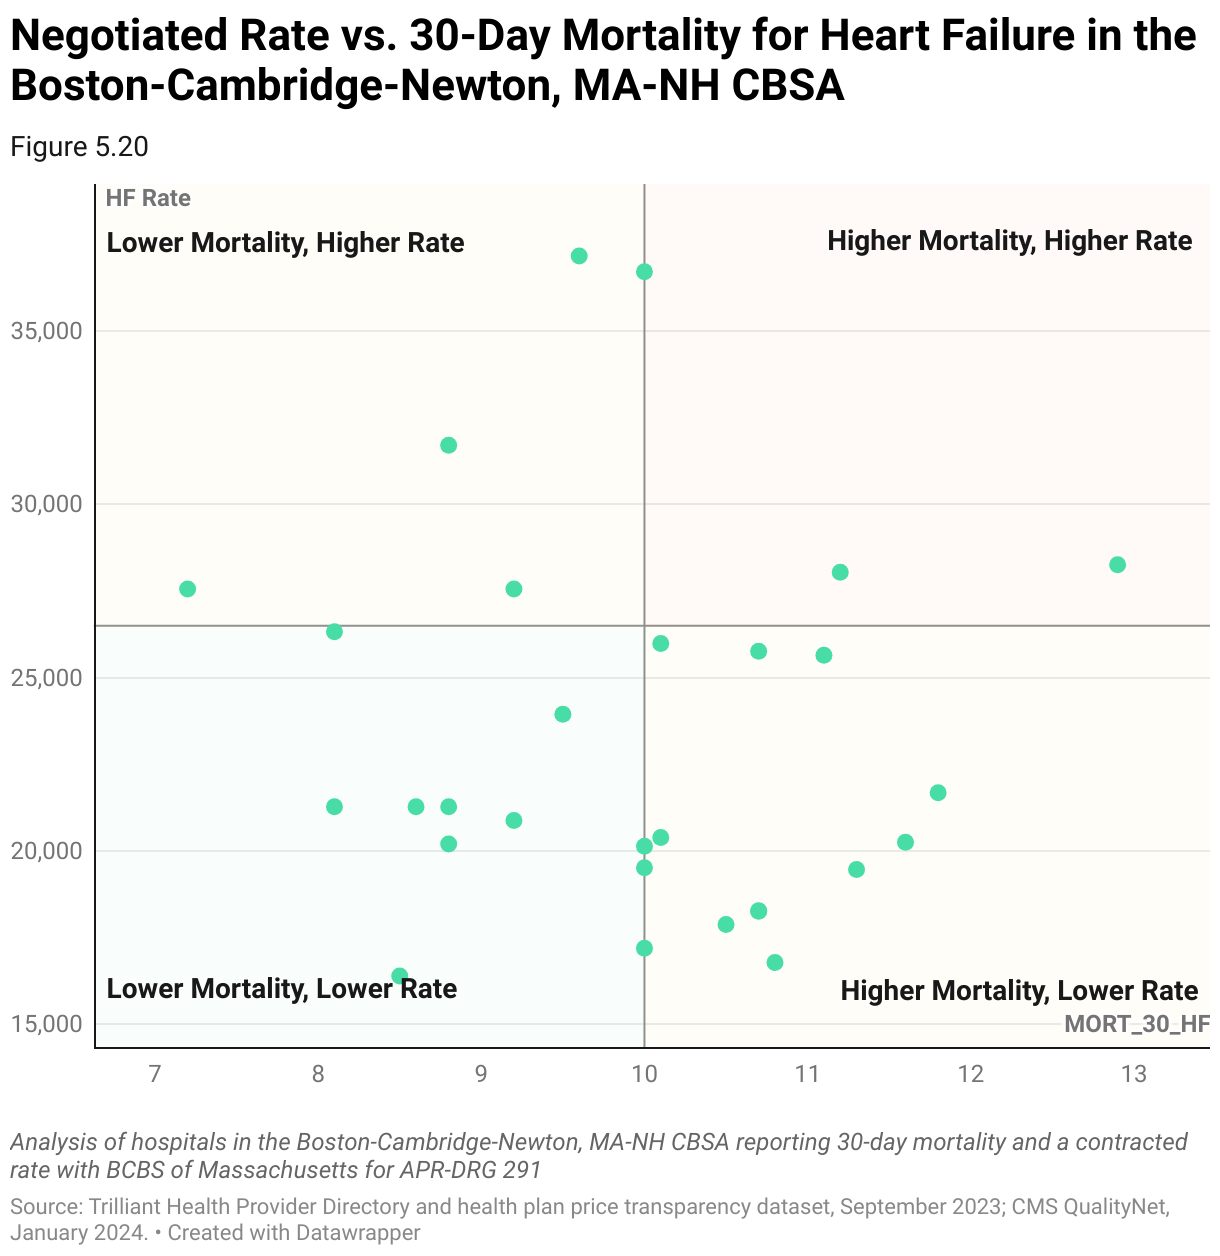
Changes in physician referral patterns resulting from M&A transactions ultimately impact the patients of the organization that is acquired, as well as the health plans and employers underwriting the care those patients receive. Whether those changes in referral patterns result in patients receiving improved value for money is something that every health economy stakeholder – especially employers – should assess.
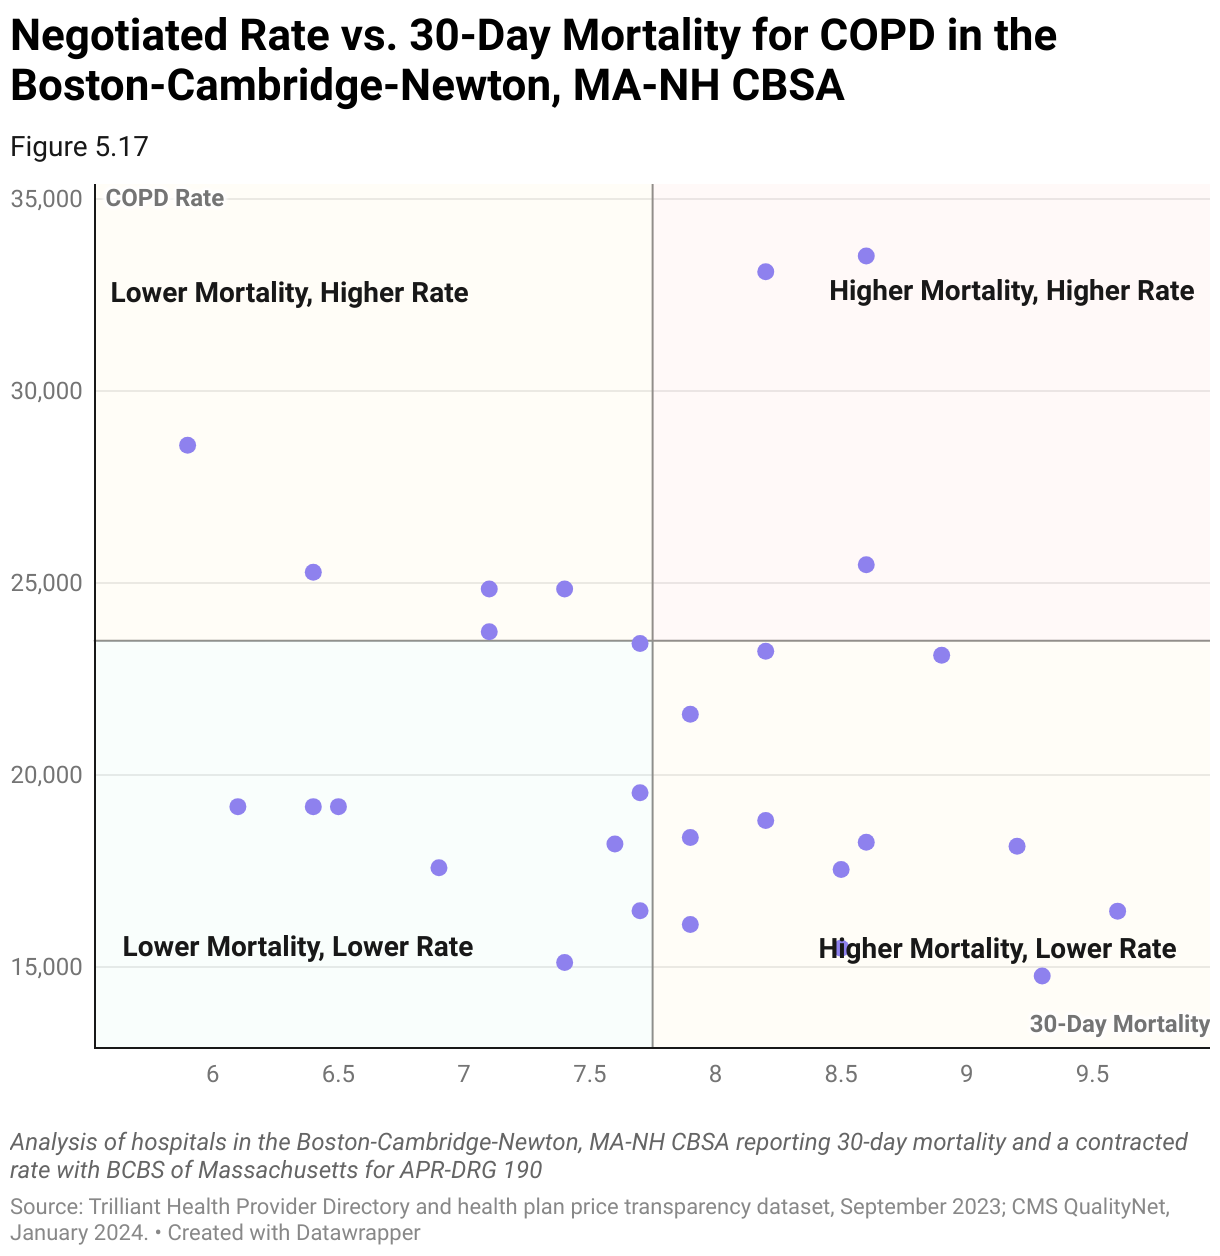
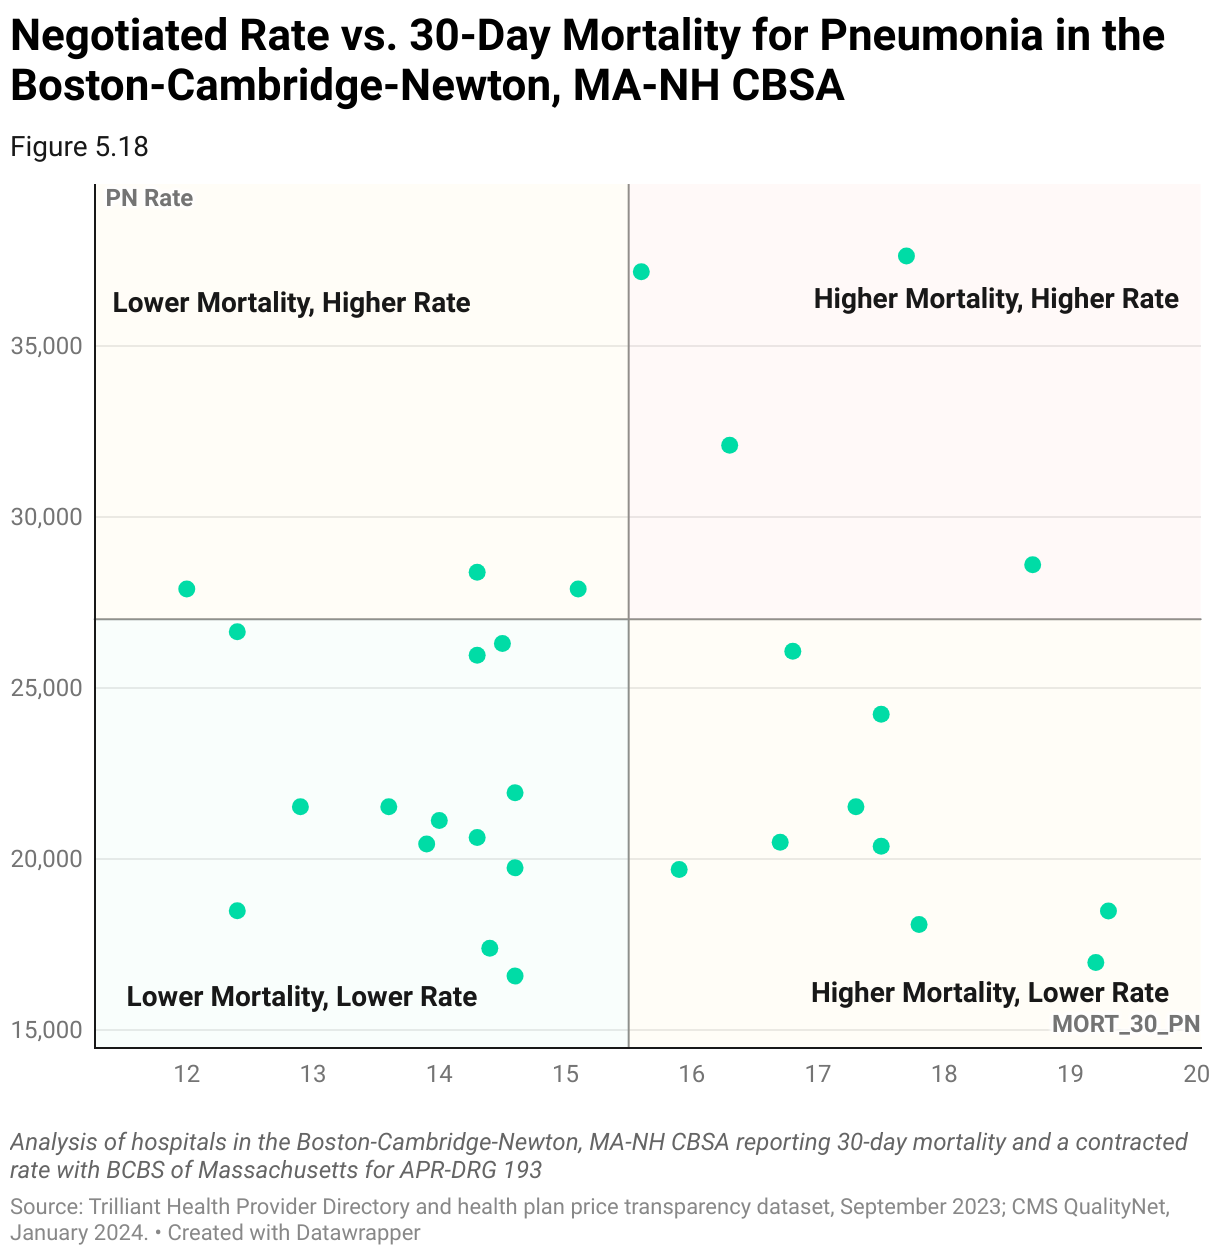
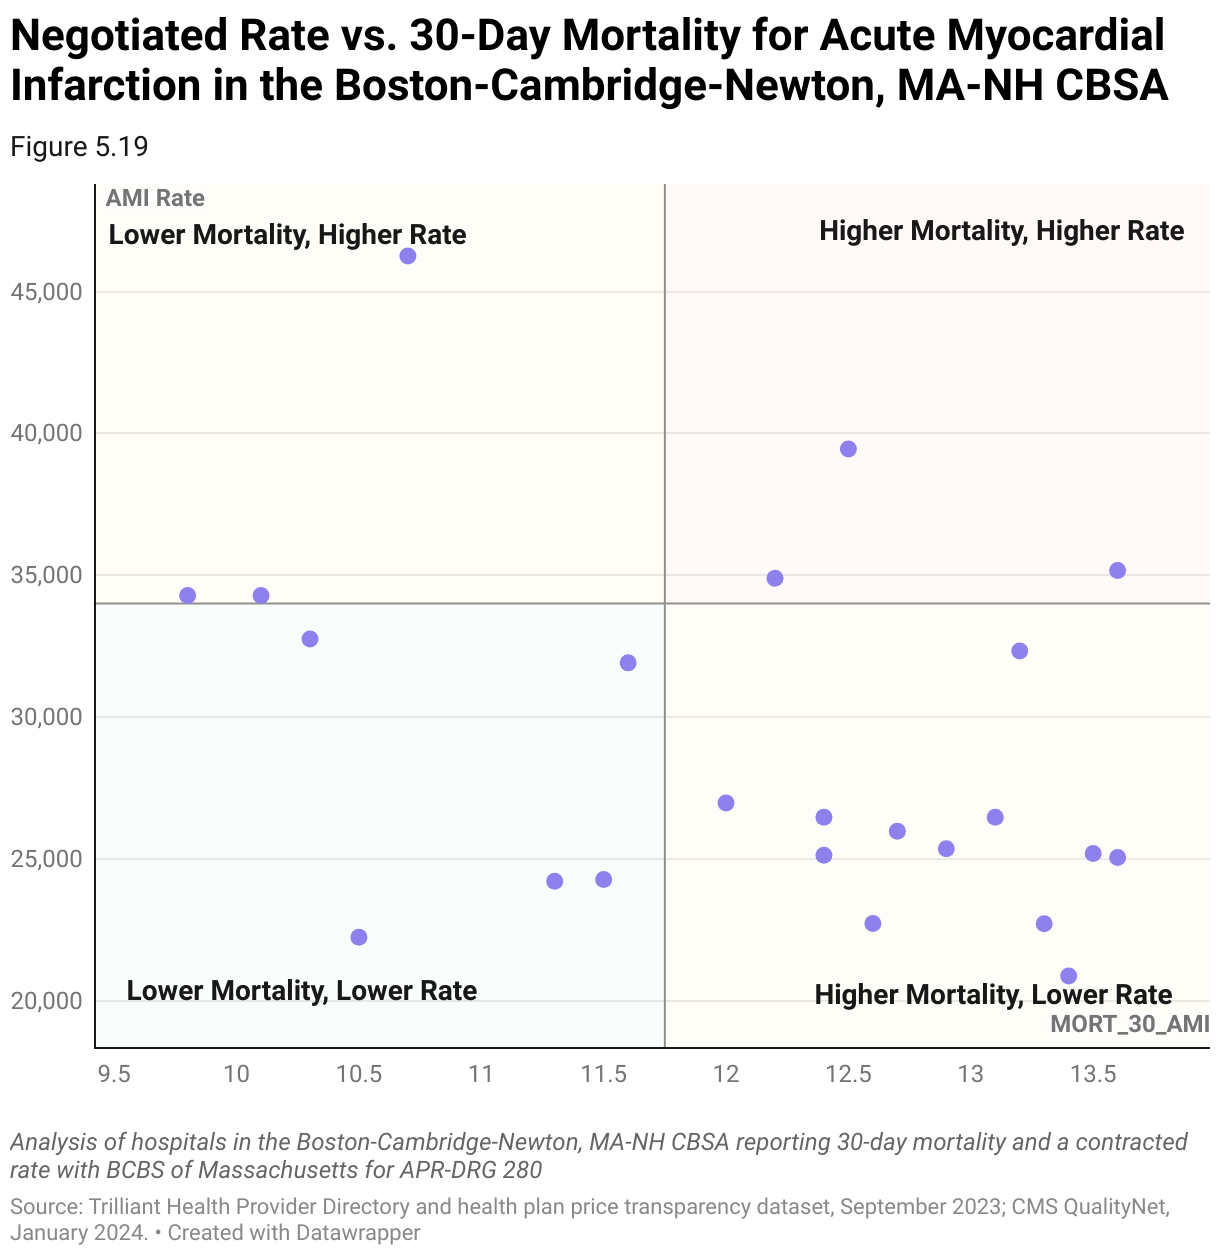
In this example, using a combination of provider directory, CMS QualityNet and health plan price transparency data, there is no observed correlation between price and quality in the Boston-Cambridge-Newton, MA-NH CBSA.
Steps to Analyze an Acquisition Opportunity:
- Internal Planning
Clearly define objectives and goals for the potential acquisition. This could include expanding service offerings, increasing market share or enhancing patient access to care.
- Curate External Market Data
Gather external market data, including demographics, patient demand, referral pattern, and payer mix. Obtain financial data from the acquisition target, including revenue, expenses, profitability and historical financial performance. Determine key metrics to evaluate the acquisition opportunity. Common metrics include referral volume, procedures performed and total revenue generated.
- Operational Analysis
Evaluate the operational capabilities and efficiency of the target acquisition. Assess factors such as clinical quality, productivity, workflow processes and technology infrastructure. Review provider credentials, payer contracts and reimbursement rates. Understand how the acquisition will impact payer relationships and negotiated rates.
- Workforce Analysis
Analyze the workforce composition of the acquisition target, including physicians, advanced practice providers and support staff. Assess staffing levels, skill sets and potential retention challenges post-acquisition.
- Technology and Infrastructure Analysis:
Evaluate the technology systems, electronic health records (EHR) and other infrastructure used by the acquisition target. Determine compatibility with existing systems and identify any potential integration challenges.
- Assess Market Impact
Leverage external market data to evaluate how the transaction will affect patient care and access to services. Consider patient satisfaction, continuity of care and potential changes in service offerings post-closing. Analyze patient migration patterns to understand how patients will respond to the transaction. Determine whether the transaction affects physician referral patterns, employment opportunities or practice affiliations. Consider how changes in physician alignment may impact patient access to care and market competition.
- Regulatory and Legal Due Diligence
Conduct due diligence to ensure compliance with healthcare regulations, licensure requirements and contractual obligations. Identify any potential legal or regulatory risks associated with the transaction.
- Transition Plan
Develop a detailed transition plan to ensure a smooth transfer of ownership and operations. Address issues such as patient notification, continuity of care, employee transitions and integration with the acquirer’s organization.
- Post-Sale Evaluation
Continuously monitor and evaluate the impact of the transaction post-closing. Assess whether the objectives and goals set initially are being achieved and make adjustments as needed.
Use Case: Using Similarity Models for M&A
In addition to flawed assumptions about the behavior of physicians, employees and patients of the target of a healthcare services M&A transaction, every corporate development executive underestimates the challenge of integrating the target into the acquirer’s organization.
Logically, if never historically, understanding the similarity between the acquirer and the target would inform projections of the success of the acquisition and, in turn, the probability of realizing the necessary return on investment. An even more sophisticated approach for acquirers would be to filter targets to enterprises that were similar to the acquirer’s most successful facilities, whether hospitals, surgery centers or clinics.
In theory, the more similar that hospitals are based on markets, services, financial and competitive metrics, the higher probability that the merged system will continue with the established “playbook” and fully integrate (i.e., the merger will play to their strengths). The more dissimilar these hospitals are, the more probable that these systems will merge in name only and have a more difficult time fully integrating.
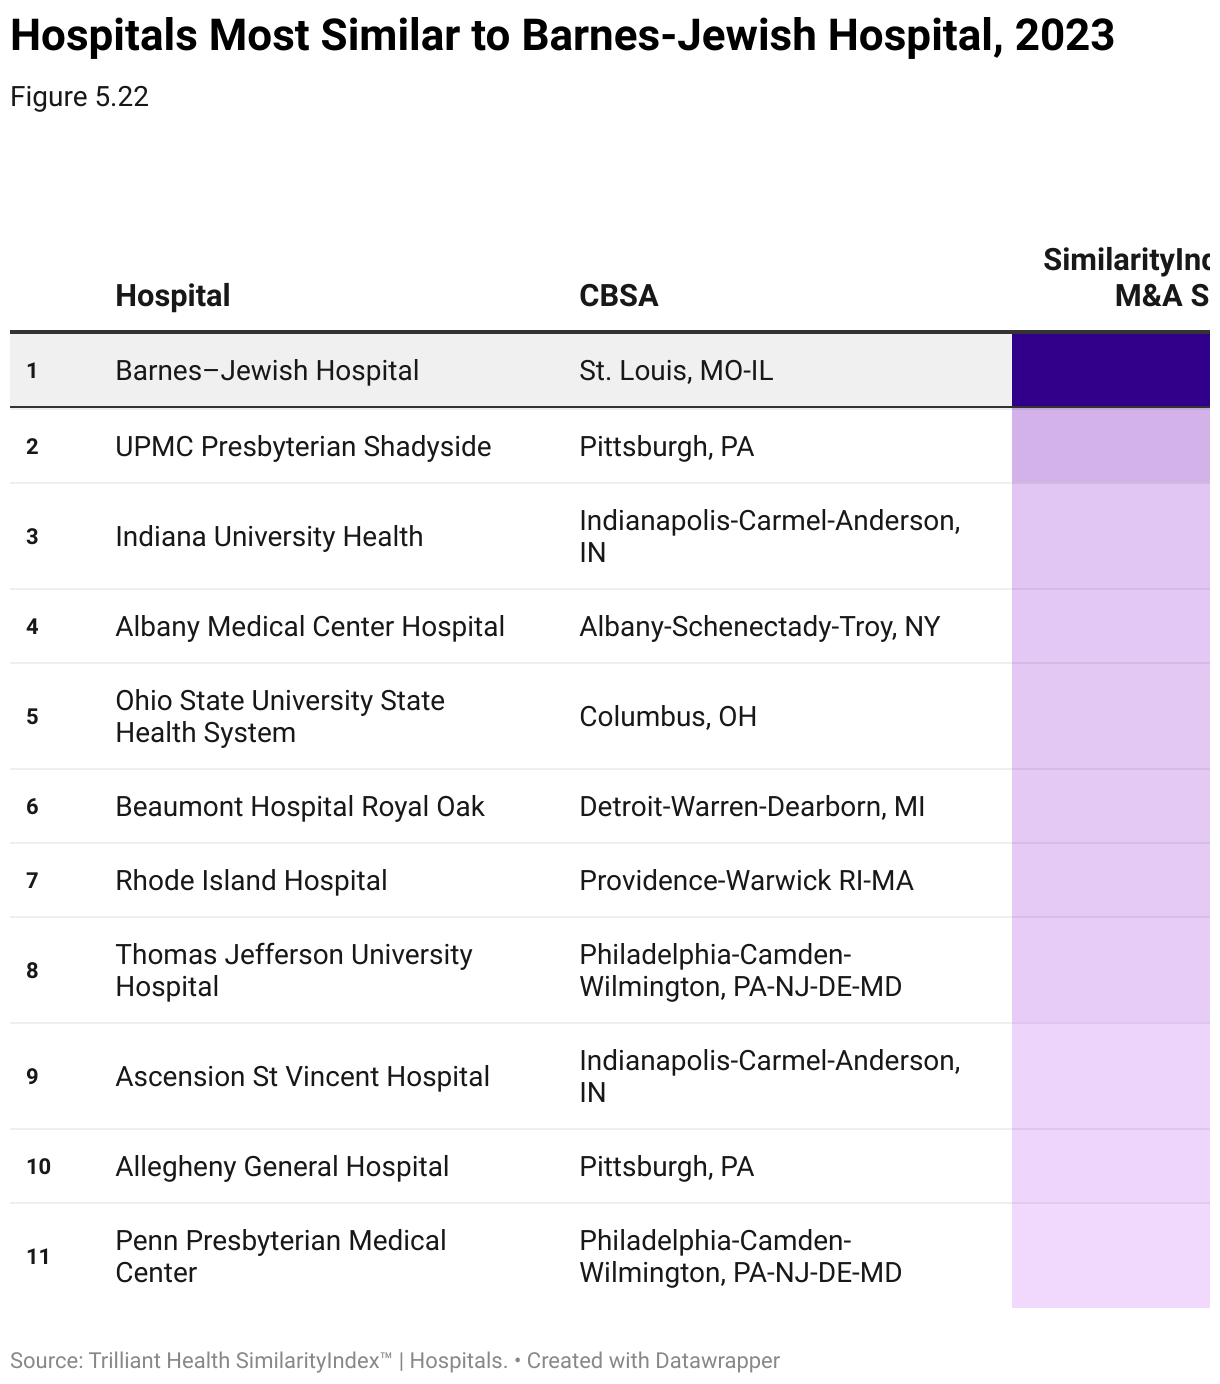
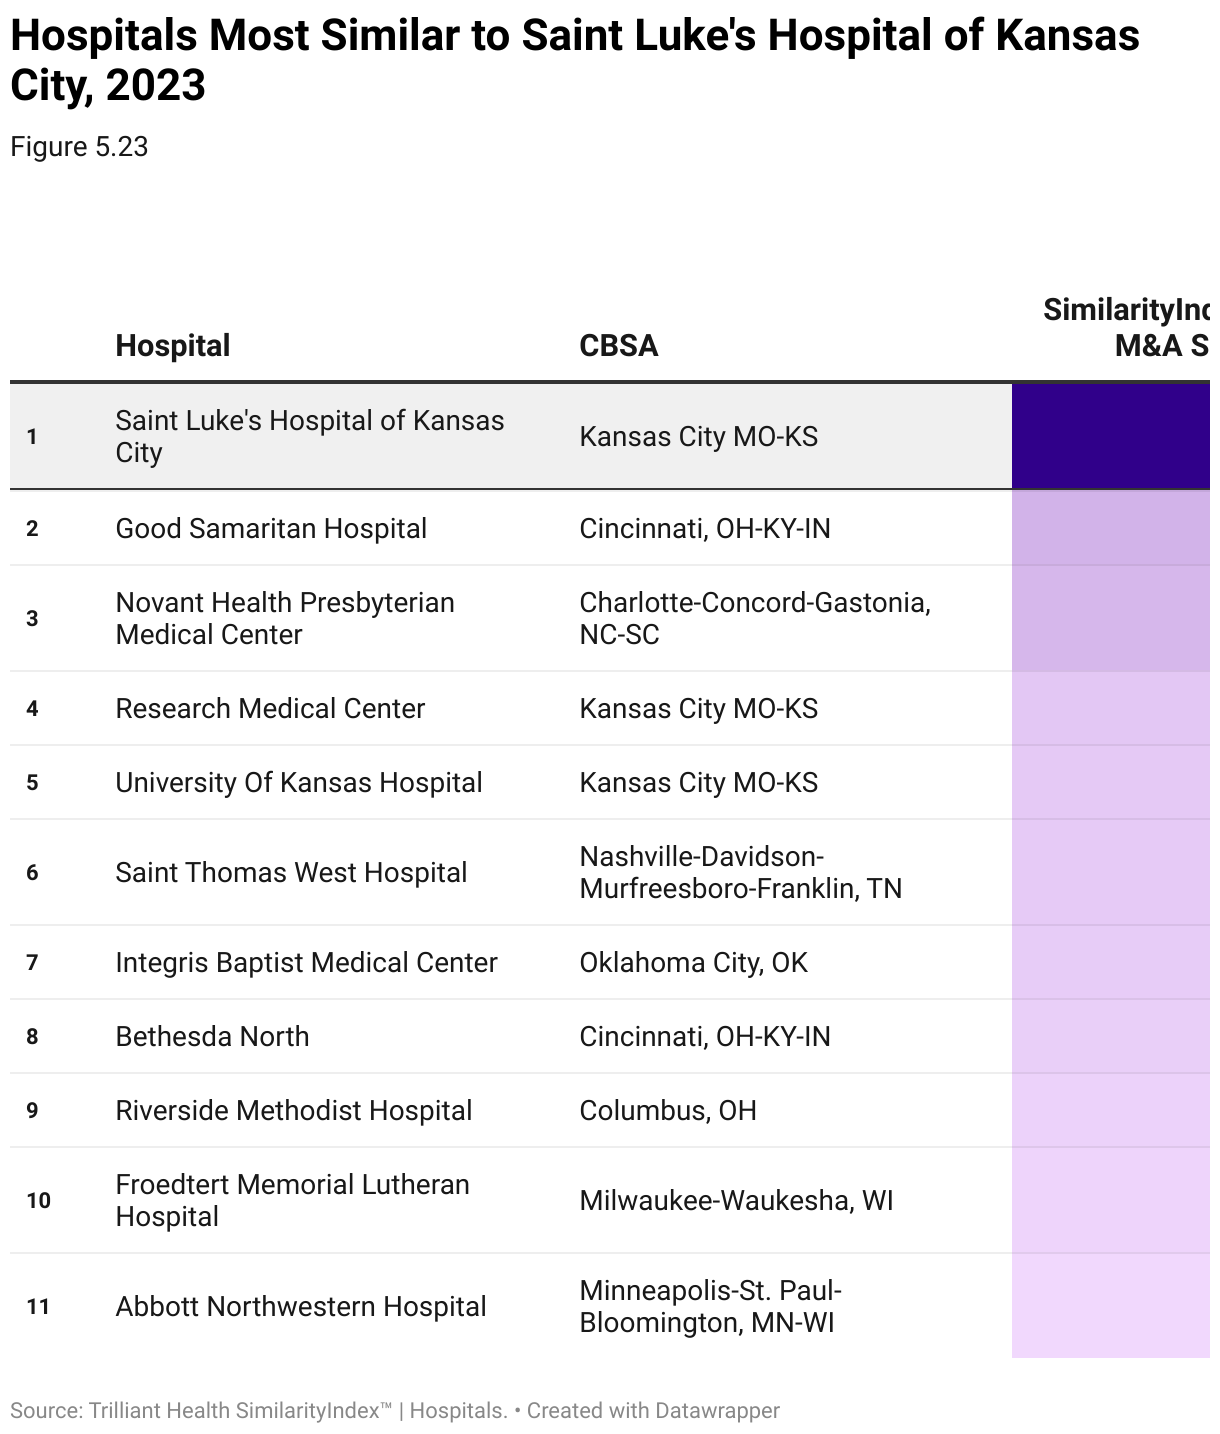
Using machine learning models to index hospitals across quality, financial performance, competition and reimbursement, this example measures the mathematical similarity of BJC HealthCare and Saint Luke’s Health System, which formed an integrated Missouri-based health system on January 1, 2024. An analysis of the largest hospital in each system – St. Luke’s Hospital of Kansas City and Barnes-Jewish Hospital – reveals the degree of similarity between the two health systems. St. Luke’s and Barnes Jewish have a SimilarityIndex® M&A Score of 76.6, or a distance of 23.4.
Said differently, using Barnes-Jewish as the index hospital, St Luke’s Kansas City is its 45th most similar hospital out of the 2,299 hospitals in the national analysis. This suggests there are several other hospitals that are operationally, financially and competitively more similar from an evidence-based perspective. An M&A strategy driven by clinical, operational, and financial similarity would lead to different partners for each system.
Hospital Cohort Rank: BJC Healthcare and St. Luke’s
Source: Trilliant Health SimilarityIndex® | Hospitals, 2023
Numerous factors influence the decision to allocate capital for M&A in healthcare services: market quality, Certificate of Need, competition, etc. As a result, the similarity between the acquirer and target will never be the sole, or even primary, consideration in a decision to consummate a transaction. At the same time, similarity analysis is useful to avoid transactions between organizations that are highly incompatible and therefore likely to integrate timely or effectively, thereby limiting the return on invested capital.